
Shareholders in Under Armour (NYSE:UAA) Have Lost 66%, as Stock Drops 7.0% This Past Week
Shareholders in Under Armour (NYSE:UAA) Have Lost 66%, as Stock Drops 7.0% This Past Week
If you love investing in stocks you're bound to buy some losers. Long term Under Armour, Inc. (NYSE:UAA) shareholders know that all too well, since the share price is down considerably over three years. Unfortunately, they have held through a 66% decline in the share price in that time. Even worse, it's down 9.6% in about a month, which isn't fun at all.
如果你喜歡投資股票,你肯定會買一些失敗者。長揸Under Armour, Inc.(紐交所:UAA)的股東們太了解了,因爲股價在三年內大幅下跌。不幸的是,他們在這段時間裏經歷了股價下跌66%。更糟糕的是,在大約一個月的時間裏,股價下跌了9.6%,這一點都不開心。
Given the past week has been tough on shareholders, let's investigate the fundamentals and see what we can learn.
考慮到過去一週對股東來說是艱難的,讓我們調查一下基本面並看看我們能學到什麼。
To paraphrase Benjamin Graham: Over the short term the market is a voting machine, but over the long term it's a weighing machine. One way to examine how market sentiment has changed over time is to look at the interaction between a company's share price and its earnings per share (EPS).
用本傑明·格雷厄姆的話來說:「短期市場是一臺投票機,但長期市場是一臺稱重機」。檢查市場情緒如何隨時間推移變化的一種方式是查看公司股價和每股收益(EPS)之間的相互作用。
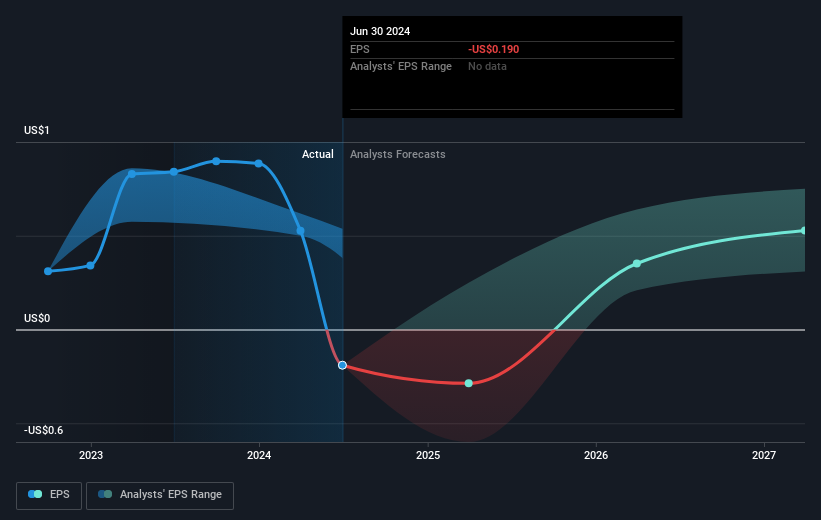
Over the three years that the share price declined, Under Armour's earnings per share (EPS) dropped significantly, falling to a loss. Extraordinary items contributed to this situation. Since the company has fallen to a loss making position, it's hard to compare the change in EPS with the share price change. However, we can say we'd expect to see a falling share price in this scenario.
在股價下跌的三年內,Under Armour的每股收益(EPS)大幅下降,降至虧損。這種情況是由於特殊項目導致的。由於公司已經陷入虧損的位置,很難將EPS的變化與股價的變化進行比較。然而,我們可以說,在這種情況下,我們預計會看到股價下跌。
You can see how EPS has changed over time in the image below (click on the chart to see the exact values).
您可以在下面的圖片中查看每股收益如何隨時間變化(單擊圖表以查看確切的價值)。
This free interactive report on Under Armour's earnings, revenue and cash flow is a great place to start, if you want to investigate the stock further.
這份關於Under Armour收益、營業收入和現金流的免費交互式報告是一個很好的起點,如果你想進一步調查這支股票。
A Different Perspective
不同的觀點
Investors in Under Armour had a tough year, with a total loss of 1.5%, against a market gain of about 24%. However, keep in mind that even the best stocks will sometimes underperform the market over a twelve month period. However, the loss over the last year isn't as bad as the 10% per annum loss investors have suffered over the last half decade. We would want clear information suggesting the company will grow, before taking the view that the share price will stabilize. You might want to assess this data-rich visualization of its earnings, revenue and cash flow.
Under Armour的投資者在過去的一年裏表現不佳,虧損了1.5%,而市場的漲幅約爲24%。然而,要記住,即使是最好的股票有時也會在12個月的時間內表現不佳。然而,過去一年的虧損並不像投資者在過去五年努力遭受的每年10%的虧損那麼糟糕。在我們認爲股價會穩定之前,我們需要明確的信息表明公司將會增長。你可能想評估一下這些數據豐富的關於其收益、營業收入和現金流的可視化。
Of course, you might find a fantastic investment by looking elsewhere. So take a peek at this free list of companies we expect will grow earnings.
當然,您可能在其他地方找到一家出色的企業進行投資。因此,請查看我們預計將實現盈利增長的公司的免費列表。
Please note, the market returns quoted in this article reflect the market weighted average returns of stocks that currently trade on American exchanges.
請注意,本文所引述的市場回報反映了目前在美國交易所上市的股票的市場加權平均回報。
Have feedback on this article? Concerned about the content? Get in touch with us directly. Alternatively, email editorial-team (at) simplywallst.com.
This article by Simply Wall St is general in nature. We provide commentary based on historical data and analyst forecasts only using an unbiased methodology and our articles are not intended to be financial advice. It does not constitute a recommendation to buy or sell any stock, and does not take account of your objectives, or your financial situation. We aim to bring you long-term focused analysis driven by fundamental data. Note that our analysis may not factor in the latest price-sensitive company announcements or qualitative material. Simply Wall St has no position in any stocks mentioned.
對本文有任何反饋?對內容有任何疑慮?請直接與我們聯繫。或者,發送電子郵件至editorial-team@simplywallst.com。
這篇文章是Simply Wall St的一般性文章。我們根據歷史數據和分析師預測提供評論,只使用公正的方法論,我們的文章並不意味着提供任何金融建議。文章不構成買賣任何股票的建議,也不考慮您的目標或您的財務狀況。我們的目標是帶給您基本數據驅動的長期關注分析。請注意,我們的分析可能不考慮最新的價格敏感公司公告或定性材料。Simply Wall St沒有任何股票頭寸。
譯文內容由第三人軟體翻譯。