
Here's What's Concerning About Capri Holdings' (NYSE:CPRI) Returns On Capital
Here's What's Concerning About Capri Holdings' (NYSE:CPRI) Returns On Capital
 0.061 = US$302m ÷ (US$6.6b - US$1.7b)
 When we're researching a company, it's sometimes hard to find the warning signs, but there are some financial metrics that can help spot trouble early. A business that's potentially in decline often shows two trends, a return on capital employed (ROCE) that's declining, and a base of capital employed that's also declining. This indicates to us that the business is not only shrinking the size of its net assets, but its returns are falling as well. On that note, looking into Capri Holdings (NYSE:CPRI), we weren't too upbeat about how things were going.
當我們研究一家公司時,有時很難找到警告信號,但是有一些財務指標可以幫助及早發現問題。可能下滑的企業通常表現出兩種趨勢,即已動用資本回報率(ROCE)下降,使用資本基礎也在下降。這向我們表明,該企業不僅在縮小其淨資產規模,而且其回報率也在下降。綜上所述,縱觀卡普里控股公司(紐約證券交易所代碼:CPRI),我們對事情的發展並不太樂觀。
What Is Return On Capital Employed (ROCE)?
什麼是資本使用回報率(ROCE)?
Just to clarify if you're unsure, ROCE is a metric for evaluating how much pre-tax income (in percentage terms) a company earns on the capital invested in its business. Analysts use this formula to calculate it for Capri Holdings:
爲了澄清一下你是否不確定,ROCE是評估公司從投資於其業務的資本中獲得多少稅前收入(按百分比計算)的指標。分析師使用這個公式來計算Capri Holdings的利潤:
Return on Capital Employed = Earnings Before Interest and Tax (EBIT) ÷ (Total Assets - Current Liabilities)
已動用資本回報率 = 息稅前收益 (EBIT) ¥(總資產-流動負債)
0.061 = US$302m ÷ (US$6.6b - US$1.7b) (Based on the trailing twelve months to June 2024).
0.061 = 3.02億美元 ÷(66億美元至17億美元)(基於截至2024年6月的過去十二個月)。
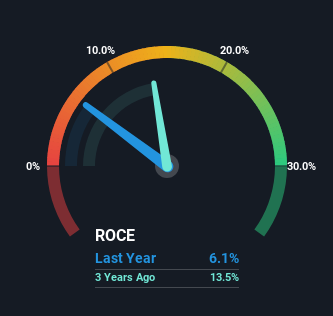
Therefore, Capri Holdings has an ROCE of 6.1%. Ultimately, that's a low return and it under-performs the Luxury industry average of 13%.
因此,卡普里控股的投資回報率爲6.1%。歸根結底,這是一個低迴報,其表現低於奢侈品行業13%的平均水平。
Above you can see how the current ROCE for Capri Holdings compares to its prior returns on capital, but there's only so much you can tell from the past. If you're interested, you can view the analysts predictions in our free analyst report for Capri Holdings .
上面你可以看到Capri Holdings當前的投資回報率與其先前的資本回報率相比如何,但從過去可以看出來的只有那麼多。如果您有興趣,可以在我們的Capri Holdings免費分析師報告中查看分析師的預測。
What Does the ROCE Trend For Capri Holdings Tell Us?
Capri Holdings的投資回報率趨勢告訴我們什麼?
In terms of Capri Holdings' historical ROCE trend, it isn't fantastic. To be more specific, today's ROCE was 12% five years ago but has since fallen to 6.1%. In addition to that, Capri Holdings is now employing 26% less capital than it was five years ago. The combination of lower ROCE and less capital employed can indicate that a business is likely to be facing some competitive headwinds or seeing an erosion to its moat. If these underlying trends continue, we wouldn't be too optimistic going forward.
就卡普里控股的歷史投資回報率趨勢而言,這並不理想。更具體地說,今天的投資回報率在五年前爲12%,但此後已降至6.1%。除此之外,Capri Holdings現在的資本比五年前減少了26%。較低的投資回報率和較少的資本使用相結合,可能表明企業可能面臨一些競爭阻力或護城河受到侵蝕。如果這些潛在趨勢繼續下去,我們對未來不會太樂觀。
The Bottom Line
底線
In summary, it's unfortunate that Capri Holdings is shrinking its capital base and also generating lower returns. In spite of that, the stock has delivered a 19% return to shareholders who held over the last five years. Regardless, we don't like the trends as they are and if they persist, we think you might find better investments elsewhere.
總而言之,不幸的是,Capri Holdings正在縮小其資本基礎,同時產生的回報也較低。儘管如此,該股爲在過去五年中持股的股東帶來了19%的回報。無論如何,我們不喜歡當前的趨勢,如果趨勢持續下去,我們認爲您可能會在其他地方找到更好的投資。
If you'd like to know about the risks facing Capri Holdings, we've discovered 1 warning sign that you should be aware of.
如果你想了解Capri Holdings面臨的風險,我們發現了一個你應該注意的警告信號。
While Capri Holdings isn't earning the highest return, check out this free list of companies that are earning high returns on equity with solid balance sheets.
儘管Capri Holdings的回報率並不高,但請查看這份免費的股票回報率高、資產負債表穩健的公司名單。
Have feedback on this article? Concerned about the content? Get in touch with us directly. Alternatively, email editorial-team (at) simplywallst.com.
This article by Simply Wall St is general in nature. We provide commentary based on historical data and analyst forecasts only using an unbiased methodology and our articles are not intended to be financial advice. It does not constitute a recommendation to buy or sell any stock, and does not take account of your objectives, or your financial situation. We aim to bring you long-term focused analysis driven by fundamental data. Note that our analysis may not factor in the latest price-sensitive company announcements or qualitative material. Simply Wall St has no position in any stocks mentioned.
對這篇文章有反饋嗎?對內容感到擔憂嗎?請直接聯繫我們。或者,也可以發送電子郵件至編輯團隊 (at) simplywallst.com。
Simply Wall St的這篇文章本質上是籠統的。我們僅使用公正的方法根據歷史數據和分析師的預測提供評論,我們的文章無意作爲財務建議。它不構成買入或賣出任何股票的建議,也沒有考慮到您的目標或財務狀況。我們的目標是爲您提供由基本數據驅動的長期重點分析。請注意,我們的分析可能不考慮最新的價格敏感型公司公告或定性材料。簡而言之,華爾街沒有持有任何上述股票的頭寸。
譯文內容由第三人軟體翻譯。
