
#Gold Technical Analysis# 24K99 News On Monday (September 9), in the early European session, spot gold continued to rebound in the short term, with the current gold price near $2495 per ounce, rebounding nearly $10 from the earlier intraday low; the intraday decline of the gold price narrowed to less than $3. FXStreet analyst Haresh Menghani wrote an article on Monday analyzing the technical trends of the gold price.
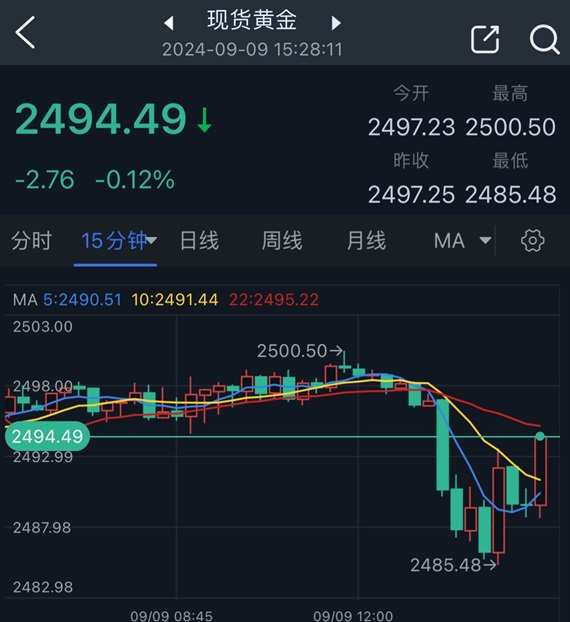
(Source: 24K99) 15-minute chart for spot gold.
Menghani pointed out that due to reduced bets on a significant rate cut by the Federal Reserve, the price of gold fell for the second consecutive trading day. The rise in US bond yields supported the US dollar and led to a decline in the gold price during the day.
Menghani added that concerns about the slowdown in the US economy and geopolitical tensions should limit further downside in the gold price.
Due to the mixed quality of the non-farm payroll data, market doubts have arisen regarding the scale of the Fed rate cut this month. Spot gold closed sharply down $19.33 last Friday, a decrease of 0.77%, at $2497.25 per ounce.
Data released by the United States last Friday showed that in August, nonfarm payrolls added 0.142 million people, far below the economists' expectations of 0.165 million people, with the previous figure revised significantly downward from 0.114 million to 0.089 million. However, the US unemployment rate in August fell from 4.3% to 4.2%, marking the first decrease in five months.
The Latest Technical Analysis of Gold
Menghani pointed out that the gold price needs to break below the $2470 per ounce support level for the bears to gain control.
According to Menghani, from a technical perspective, the gold price has been fluctuating within a familiar range for the past three weeks. This has formed a rectangle on the short-term chart, indicating that traders are hesitant about the next phase of the trend. However, in the context of a strong rebound to historical highs, the price movement within the range may still be classified as a bullish consolidation phase. In addition, the oscillation indicator on the daily chart, although losing traction, remains in positive territory.
If gold encounters further decline, the support level near 2471-2470 USD/ounce may be seen as a buying opportunity. The latter marks the lower boundary of the trading range and should be seen as a key pivot point. If this level is breached, it may trigger some technical selling and test the 50-day simple moving average (SMA) support level, which is currently located near 2443-2442 USD/ounce.
The downward trajectory may further extend to the key psychological level of 2400 USD/ounce and then fall to the 100-day moving average, around the 2390-2389 USD range.
On the other hand, Menghani adds that any significant rally now seems to face strong resistance around the 2520 USD/ounce area. The next resistance is at the 2530-2532 USD/ounce area or the historical peak.
Some follow-up buying may be seen as a new trigger by bullish traders, laying the foundation for further strength in the gold price.
At 15:28 Beijing time, spot gold is trading at 2494.49 USD/ounce.