
#Gold Technical Analysis# 24K99 News On Monday (September 9th), in the Asian afternoon session, spot gold suddenly plunged rapidly in the short term, breaking through the $2490 per ounce mark, with a sharp drop of nearly $10 within the day. Economies.com, a well-known financial news website, published the latest analysis of the short-term technical outlook for gold on Monday.
Analysts pointed out that the U.S. Dollar Index maintained an intraday rebound trend, currently near 101.40, putting pressure on the gold price.
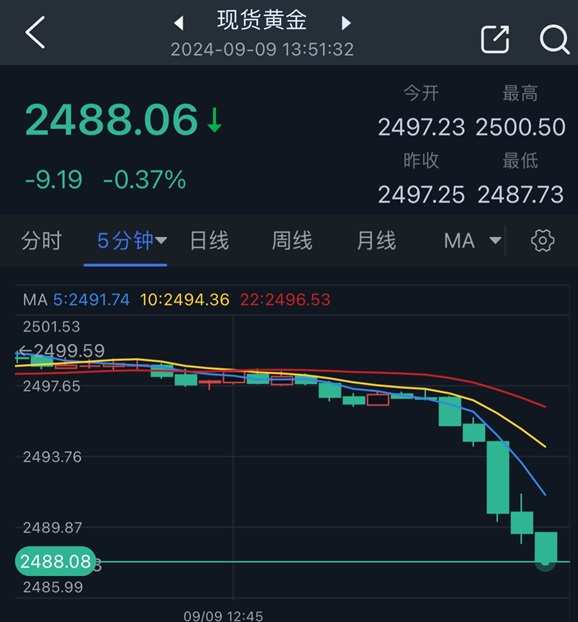
(Spot gold 5-minute chart Source: 24K99)
According to Economies.com, the price of gold is currently facing bearish pressure. Once the gold price falls below $2483.40 per ounce, this will halt the expected uptrend and trigger a larger correction in the gold price.
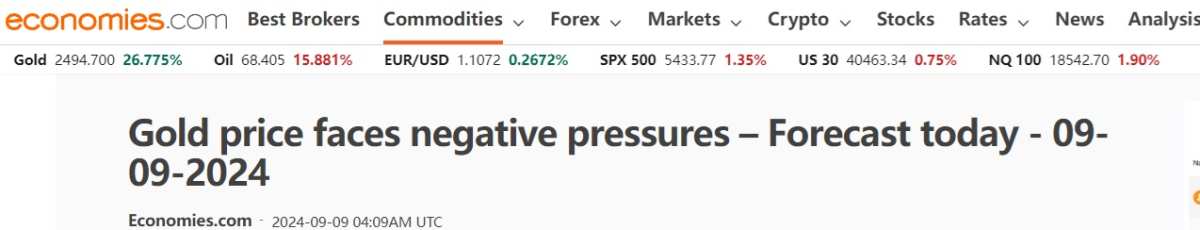
(Screenshot source: Economies.com)
Spot gold closed sharply lower on Friday, down $19.33, or 0.77%, at $2497.25 per ounce. After the release of the non-farm payroll report, the gold price once plummeted to $2484.91 per ounce.
Analysts pointed out that the reason for the sharp drop in gold prices on Friday was the mixed results of the non-farm payroll data, which raised doubts in the market about the scale of interest rate cuts by the Federal Reserve this month.
The non-farm payroll report released in the United States last Friday was a mixed bag. The number of non-farm payroll additions in August was 0.142 million, far below the economists' expectations of 0.165 million, and the previous value was significantly revised down from 0.114 million to 0.089 million. However, the U.S. unemployment rate for August fell from 4.3% to 4.2%, the first decrease in five months.
Economies.com wrote in the article that the price of gold stopped falling around $2483.40 per ounce last Friday and then started to rebound, indicating that the price of gold will recover again. From the 4-hour chart of gold, the stochastic indicator is delivering a positive signal. It is expected that the price of gold will be in an upward trend in the next few trading sessions, with the first bullish target testing $2540.00 per ounce.

(Spot gold 4-hour chart Source: Economies.com)
Economies.com states that if the price of gold breaks through $2500.00 per ounce, it will help push the price of gold to the awaited bullish target. On the other hand, once the price of gold falls below $2483.40 per ounce, it will push the price of gold to test the bullish trendline near $2455.00 per ounce, and then attempt an upward move again.
Economies.com predicts that today's gold price will trade between the support level of $2485.00 per ounce and the resistance level of $2520.00 per ounce.
Economies.com stated that the expected trend for gold prices today is bullish.
At 13:51 Beijing time, the spot gold was reported at $2488.06 per ounce.