
STAAR Surgical (NASDAQ:STAA) Has Some Way To Go To Become A Multi-Bagger
STAAR Surgical (NASDAQ:STAA) Has Some Way To Go To Become A Multi-Bagger
If we want to find a potential multi-bagger, often there are underlying trends that can provide clues. Firstly, we'll want to see a proven return on capital employed (ROCE) that is increasing, and secondly, an expanding base of capital employed. This shows us that it's a compounding machine, able to continually reinvest its earnings back into the business and generate higher returns. However, after investigating STAAR Surgical (NASDAQ:STAA), we don't think it's current trends fit the mold of a multi-bagger.
如果我們想找到一個潛在的多倍增長股,通常會有一些潛在的趨勢可以提供線索。首先,我們希望看到資本回報率(ROCE)在增長,其次,是不斷擴大的資本投入基礎。這向我們展示了這是一臺複利機器,能夠不斷將盈利重新投入到業務中併產生更高的回報。然而,在調查STAAR Surgical (納斯達克:STAA)後,我們認爲它目前的趨勢不符合多倍增長的模式。
What Is Return On Capital Employed (ROCE)?
我們對 Enphase Energy 的資本僱用回報率的看法:正如我們上面看到的,Enphase Energy 的資本回報率沒有提高,但它正在重新投資於業務。投資者必須認爲未來會有更好的前景,因爲股票表現良好,使持股五年以上的股東獲得了 690% 的收益。最終,如果基本趨勢持續存在,我們不會對它成爲一隻多頭股持有期很久很有信心。
Just to clarify if you're unsure, ROCE is a metric for evaluating how much pre-tax income (in percentage terms) a company earns on the capital invested in its business. To calculate this metric for STAAR Surgical, this is the formula:
只是爲了澄清,如果您不確定的話,ROCE是用來評估公司在其業務中投入的資本所獲得的稅前收入的指標(以百分比表示)。要計算STAAR Surgical的這個指標,可以使用以下公式:
Return on Capital Employed = Earnings Before Interest and Tax (EBIT) ÷ (Total Assets - Current Liabilities)
資產僱用回報率(ROCE)是指企業利潤,即企業稅前利潤除以企業投入的總資本(負債加股權)。如果ROCE高於企業財務成本的承受能力,那麼企業就會創造出更多的價值。
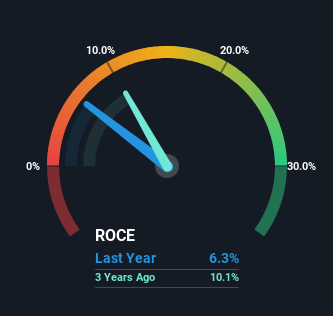
0.063 = US$28m ÷ (US$513m - US$66m) (Based on the trailing twelve months to June 2024).
0.063 = 美元2,800萬 ÷ (美元5,1300萬 - 美元6600萬) (基於截至2024年6月的過去十二個月)。
Thus, STAAR Surgical has an ROCE of 6.3%. In absolute terms, that's a low return and it also under-performs the Medical Equipment industry average of 9.6%.
因此,STAAR Surgical的ROCE爲6.3%。就絕對值而言,這是一個較低的回報率,而且也低於醫療設備行業的平均水平9.6%。
In the above chart we have measured STAAR Surgical's prior ROCE against its prior performance, but the future is arguably more important. If you'd like, you can check out the forecasts from the analysts covering STAAR Surgical for free.
在上面的圖表中,我們測量了staar surgical之前的ROCE與其之前的表現,但未來無疑更爲重要。如果您願意,您可以免費查看覆蓋staar surgical的分析師的預測。
What Can We Tell From STAAR Surgical's ROCE Trend?
我們可以從staar surgical的ROCE趨勢中得出什麼結論?
There are better returns on capital out there than what we're seeing at STAAR Surgical. The company has consistently earned 6.3% for the last five years, and the capital employed within the business has risen 184% in that time. Given the company has increased the amount of capital employed, it appears the investments that have been made simply don't provide a high return on capital.
市場上有比staar surgical更好的資本回報率。該公司在過去五年中始終保持6.3%的盈利,而業務中投入的資本在此期間增長了184%。鑑於公司增加了投入的資本量,似乎這些投資並未提供高額的資本回報。
In Conclusion...
最後,同等資本下回報率較低的趨勢通常不是我們關注創業板股票的最佳信號。由於這些發展進行良好,因此投資者不太可能表現友好。自五年前以來,該股下跌了32%。除非這些指標朝着更積極的軌跡轉變,否則我們將繼續尋找其他股票。
In summary, STAAR Surgical has simply been reinvesting capital and generating the same low rate of return as before. And investors may be recognizing these trends since the stock has only returned a total of 6.5% to shareholders over the last five years. So if you're looking for a multi-bagger, the underlying trends indicate you may have better chances elsewhere.
總而言之,staar surgical只是在重新投入資本並以之前的低迴報率進行經營。由於過去五年中股票只爲股東們帶來了總計6.5%的回報,投資者可能會意識到這些趨勢。因此,如果您正在尋找一個多倍投資機會,基本趨勢表明您可能在其他地方有更好的機會。
One more thing, we've spotted 1 warning sign facing STAAR Surgical that you might find interesting.
還有一件事,我們發現staar surgical面臨1個警告信號,您可能會覺得有趣。
While STAAR Surgical isn't earning the highest return, check out this free list of companies that are earning high returns on equity with solid balance sheets.
雖然staar surgical的回報率不是最高的,但請查看這份免費的公司列表,這些公司在股本回報率和健全資產負債表方面都有較高的表現。
Have feedback on this article? Concerned about the content? Get in touch with us directly. Alternatively, email editorial-team (at) simplywallst.com.
This article by Simply Wall St is general in nature. We provide commentary based on historical data and analyst forecasts only using an unbiased methodology and our articles are not intended to be financial advice. It does not constitute a recommendation to buy or sell any stock, and does not take account of your objectives, or your financial situation. We aim to bring you long-term focused analysis driven by fundamental data. Note that our analysis may not factor in the latest price-sensitive company announcements or qualitative material. Simply Wall St has no position in any stocks mentioned.
對本文有任何反饋?對內容有任何疑慮?請直接與我們聯繫。或者,發送電子郵件至editorial-team@simplywallst.com。
這篇文章是Simply Wall St的一般性文章。我們根據歷史數據和分析師預測提供評論,只使用公正的方法論,我們的文章並不意味着提供任何金融建議。文章不構成買賣任何股票的建議,也不考慮您的目標或您的財務狀況。我們的目標是帶給您基本數據驅動的長期關注分析。請注意,我們的分析可能不考慮最新的價格敏感公司公告或定性材料。Simply Wall St沒有任何股票頭寸。
譯文內容由第三人軟體翻譯。