
Flowserve (NYSE:FLS) Sheds 8.8% This Week, as Yearly Returns Fall More in Line With Earnings Growth
Flowserve (NYSE:FLS) Sheds 8.8% This Week, as Yearly Returns Fall More in Line With Earnings Growth
 During three years of share price growth, Flowserve achieved compound earnings per share growth of 14% per year. This EPS growth is higher than the 8% average annual increase in the share price. So one could reasonably conclude that the market has cooled on the stock.
 By buying an index fund, investors can approximate the average market return. But if you buy good businesses at attractive prices, your portfolio returns could exceed the average market return. Just take a look at Flowserve Corporation (NYSE:FLS), which is up 27%, over three years, soundly beating the market return of 9.8% (not including dividends). On the other hand, the returns haven't been quite so good recently, with shareholders up just 15%, including dividends.
通過購買指數基金,投資者可以近似獲得市場的平均回報。但是,如果您以有吸引力的價格購買優質企業,您的投資組合回報可能超過市場平均回報。只需看看福斯公司(NYSE:FLS),其股價上漲了27%,在三年內,遠遠超過市場回報率9.8%(不包括分紅)。另一方面,最近的回報並不那麼理想,包括分紅股東僅上漲了15%。
In light of the stock dropping 8.8% in the past week, we want to investigate the longer term story, and see if fundamentals have been the driver of the company's positive three-year return.
鑑於過去一週股價下跌了8.8%,我們想調查更長期的情況,看基本面是否是該公司三年回報的主要因素。
To paraphrase Benjamin Graham: Over the short term the market is a voting machine, but over the long term it's a weighing machine. One imperfect but simple way to consider how the market perception of a company has shifted is to compare the change in the earnings per share (EPS) with the share price movement.
爲了概述本傑明·格雷厄姆(Benjamin Graham)的話:短期內,市場是一臺投票機,但長期來看,它是一臺衡重機。思考一家公司的市場感知如何轉變的一種不完美但簡單的方法是將每股收益(EPS)變化與股價變動進行比較。
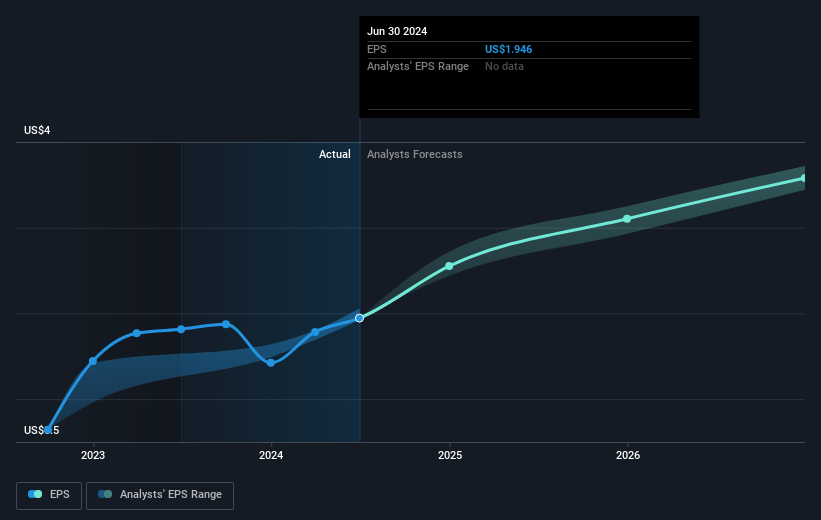
During three years of share price growth, Flowserve achieved compound earnings per share growth of 14% per year. This EPS growth is higher than the 8% average annual increase in the share price. So one could reasonably conclude that the market has cooled on the stock.
在三年的股價增長中,福斯的每股收益複合年增長率達到了14%。這種每股收益的增長高於每股股價的平均年增長率8%。因此,可以合理地得出結論,市場對該股票影響力較小。
The image below shows how EPS has tracked over time (if you click on the image you can see greater detail).
下圖顯示了EPS隨時間的變化情況(如果您單擊該圖像,則可以查看更多詳細信息)。
Before buying or selling a stock, we always recommend a close examination of historic growth trends, available here.
在購買或出售股票之前,我們始終建議對歷史增長趨勢進行仔細研究,可以在這裏找到相關信息。
What About Dividends?
那麼分紅怎麼樣呢?
It is important to consider the total shareholder return, as well as the share price return, for any given stock. The TSR is a return calculation that accounts for the value of cash dividends (assuming that any dividend received was reinvested) and the calculated value of any discounted capital raisings and spin-offs. It's fair to say that the TSR gives a more complete picture for stocks that pay a dividend. We note that for Flowserve the TSR over the last 3 years was 36%, which is better than the share price return mentioned above. The dividends paid by the company have thusly boosted the total shareholder return.
對於任何給定的股票,考慮總股東回報率以及股價回報率都是很重要的。TSR是一種返回計算,它考慮了現金股息的價值(假設任何收到的股息都是再投資的)以及任何折現資本融資和分拆的計算價值。可以說,TSR爲支付股息的股票提供了更全面的圖片。我們注意到,對於福斯而言,在過去3年內,TSR達到了36%,高於上述股價回報率。公司支付的股息因此提高了股東的總回報。
A Different Perspective
不同的觀點
Flowserve provided a TSR of 15% over the last twelve months. But that return falls short of the market. The silver lining is that the gain was actually better than the average annual return of 1.1% per year over five year. This suggests the company might be improving over time. It's always interesting to track share price performance over the longer term. But to understand Flowserve better, we need to consider many other factors. Consider for instance, the ever-present spectre of investment risk. We've identified 1 warning sign with Flowserve , and understanding them should be part of your investment process.
福斯過去12個月提供了15%的TSR。但這個回報不及市場。好消息是,這個收益實際上比過去五年的平均年回報率1.1%要好。這表明公司可能在不斷改善。從長期來看,跟蹤股價表現總是很有趣的。但要更好地了解福斯,我們需要考慮許多其他因素。例如,永遠潛在的投資風險。我們已經發現1個福斯的警示標誌,了解它們應該成爲您的投資流程的一部分。
If you are like me, then you will not want to miss this free list of undervalued small caps that insiders are buying.
如果您像我一樣,就不會希望錯過這份免費的內部人士正在購買的低估小市值股票列表。
Please note, the market returns quoted in this article reflect the market weighted average returns of stocks that currently trade on American exchanges.
請注意,本文所引述的市場回報反映了目前在美國交易所上市的股票的市場加權平均回報。
Have feedback on this article? Concerned about the content? Get in touch with us directly. Alternatively, email editorial-team (at) simplywallst.com.
This article by Simply Wall St is general in nature. We provide commentary based on historical data and analyst forecasts only using an unbiased methodology and our articles are not intended to be financial advice. It does not constitute a recommendation to buy or sell any stock, and does not take account of your objectives, or your financial situation. We aim to bring you long-term focused analysis driven by fundamental data. Note that our analysis may not factor in the latest price-sensitive company announcements or qualitative material. Simply Wall St has no position in any stocks mentioned.
對本文有任何反饋?對內容有任何疑慮?請直接與我們聯繫。或者,發送電子郵件至editorial-team@simplywallst.com。
這篇文章是Simply Wall St的一般性文章。我們根據歷史數據和分析師預測提供評論,只使用公正的方法論,我們的文章並不意味着提供任何金融建議。文章不構成買賣任何股票的建議,也不考慮您的目標或您的財務狀況。我們的目標是帶給您基本數據驅動的長期關注分析。請注意,我們的分析可能不考慮最新的價格敏感公司公告或定性材料。Simply Wall St沒有任何股票頭寸。
譯文內容由第三人軟體翻譯。