
Commercial Metals (NYSE:CMC) Sheds 5.2% This Week, as Yearly Returns Fall More in Line With Earnings Growth
Commercial Metals (NYSE:CMC) Sheds 5.2% This Week, as Yearly Returns Fall More in Line With Earnings Growth
The most you can lose on any stock (assuming you don't use leverage) is 100% of your money. But on a lighter note, a good company can see its share price rise well over 100%. One great example is Commercial Metals Company (NYSE:CMC) which saw its share price drive 192% higher over five years. The last week saw the share price soften some 5.2%.
任何股票的最大虧損金額(假設您不使用槓桿)爲您的全部資金的100%。但是好公司的股價可能會上漲超過100%。一個很好的例子是美國工商五金公司(NYSE:CMC),股價在五年內上漲了192%。最近一週股價下跌了5.2%。
Although Commercial Metals has shed US$322m from its market cap this week, let's take a look at its longer term fundamental trends and see if they've driven returns.
儘管美國工商五金公司這一週市值減少了32200萬美元,我們來看一下它的長期基本趨勢,看看是否對回報產生了影響。
While markets are a powerful pricing mechanism, share prices reflect investor sentiment, not just underlying business performance. One imperfect but simple way to consider how the market perception of a company has shifted is to compare the change in the earnings per share (EPS) with the share price movement.
雖然市場是一個強大的定價機制,但股價反映的不僅僅是企業的基本業績,還有投資者的情緒。一個不完美但簡單的方式來考慮公司市場意識的變化是比較每股收益(EPS)的變化和股價的變化。
Over half a decade, Commercial Metals managed to grow its earnings per share at 29% a year. This EPS growth is reasonably close to the 24% average annual increase in the share price. This indicates that investor sentiment towards the company has not changed a great deal. Rather, the share price has approximately tracked EPS growth.
在五年的時間裏,美國工商五金公司的每股收益增長了29%。這個每股收益增長率與股價每年平均增加24%的增長率相當接近。這表明對公司的投資者情緒並沒有發生太大的變化。相反,股價大致跟蹤着每股收益的增長。
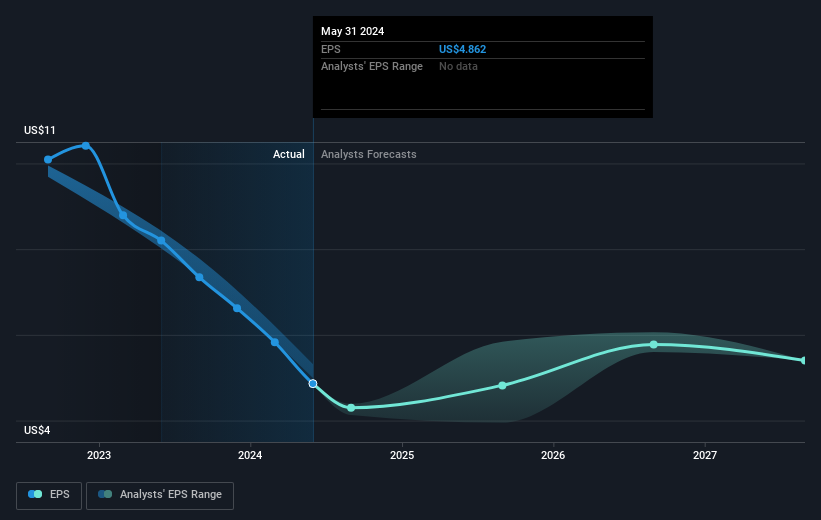
You can see how EPS has changed over time in the image below (click on the chart to see the exact values).
您可以在下面的圖片中查看每股收益如何隨時間變化(單擊圖表以查看確切的價值)。
We like that insiders have been buying shares in the last twelve months. Having said that, most people consider earnings and revenue growth trends to be a more meaningful guide to the business. Dive deeper into the earnings by checking this interactive graph of Commercial Metals' earnings, revenue and cash flow.
我們喜歡看到內部人士在過去十二個月裏購買股票。儘管如此,大多數人認爲收益和營收增長趨勢更能指導業務。通過查看美國工商五金公司盈利、營收和現金流的互動圖表,深入了解盈利情況。
What About Dividends?
那麼分紅怎麼樣呢?
As well as measuring the share price return, investors should also consider the total shareholder return (TSR). The TSR is a return calculation that accounts for the value of cash dividends (assuming that any dividend received was reinvested) and the calculated value of any discounted capital raisings and spin-offs. It's fair to say that the TSR gives a more complete picture for stocks that pay a dividend. We note that for Commercial Metals the TSR over the last 5 years was 219%, which is better than the share price return mentioned above. And there's no prize for guessing that the dividend payments largely explain the divergence!
除了測量股價回報,投資者還應考慮總股東回報(TSR)。TSR是一個回報計算,考慮到現金股息的價值(假設任何收到的股息都是再投資的),以及任何折價增資和分拆的計算價值。可以說TSR對於支付股息的股票來說更能提供一個更完整的畫面。我們注意到,在過去的5年裏,美國工商五金公司的TSR達到了219%,這比上述股價回報要好。很明顯,這種差異主要是由股息支付所解釋的!
A Different Perspective
不同的觀點
Investors in Commercial Metals had a tough year, with a total loss of 8.3% (including dividends), against a market gain of about 23%. Even the share prices of good stocks drop sometimes, but we want to see improvements in the fundamental metrics of a business, before getting too interested. Longer term investors wouldn't be so upset, since they would have made 26%, each year, over five years. It could be that the recent sell-off is an opportunity, so it may be worth checking the fundamental data for signs of a long term growth trend. I find it very interesting to look at share price over the long term as a proxy for business performance. But to truly gain insight, we need to consider other information, too. Consider risks, for instance. Every company has them, and we've spotted 1 warning sign for Commercial Metals you should know about.
美國工商五金公司的投資者度過了一個艱難的一年,總虧損達8.3%(包括股息),而市場收益約爲23%。即使好股票的股價有時也會下跌,但我們希望在對業務產生濃厚興趣之前,看到基本指標的改善。從長期來看,投資者對此可能不會太沮喪,因爲在過去五年裏,他們每年都會獲得26%的回報。目前的拋售可能是個機會,因此有必要檢查基本數據,看看是否有長期增長趨勢的跡象。作爲衡量業務績效的一個代理,我發現長期股價非常有趣。但爲了真正獲得洞察力,我們還需要考慮其他信息。比如,考慮風險。每個公司都有風險,我們已經發現了Commercial Metals 1個警示信號,你應該了解一下。
If you like to buy stocks alongside management, then you might just love this free list of companies. (Hint: most of them are flying under the radar).
如果您喜歡與管理層共同購買股票,那麼您可能會喜歡這個免費的公司列表(提示:大多數公司沒有受到關注)。
Please note, the market returns quoted in this article reflect the market weighted average returns of stocks that currently trade on American exchanges.
請注意,本文所引述的市場回報反映了目前在美國交易所上市的股票的市場加權平均回報。
Have feedback on this article? Concerned about the content? Get in touch with us directly. Alternatively, email editorial-team (at) simplywallst.com.
This article by Simply Wall St is general in nature. We provide commentary based on historical data and analyst forecasts only using an unbiased methodology and our articles are not intended to be financial advice. It does not constitute a recommendation to buy or sell any stock, and does not take account of your objectives, or your financial situation. We aim to bring you long-term focused analysis driven by fundamental data. Note that our analysis may not factor in the latest price-sensitive company announcements or qualitative material. Simply Wall St has no position in any stocks mentioned.
對本文有任何反饋?對內容有任何疑慮?請直接與我們聯繫。或者,發送電子郵件至editorial-team@simplywallst.com。
這篇文章是Simply Wall St的一般性文章。我們根據歷史數據和分析師預測提供評論,只使用公正的方法論,我們的文章並不意味着提供任何金融建議。文章不構成買賣任何股票的建議,也不考慮您的目標或您的財務狀況。我們的目標是帶給您基本數據驅動的長期關注分析。請注意,我們的分析可能不考慮最新的價格敏感公司公告或定性材料。Simply Wall St沒有任何股票頭寸。
譯文內容由第三人軟體翻譯。