
Even Though APi Group (NYSE:APG) Has Lost US$459m Market Cap in Last 7 Days, Shareholders Are Still up 268% Over 5 Years
Even Though APi Group (NYSE:APG) Has Lost US$459m Market Cap in Last 7 Days, Shareholders Are Still up 268% Over 5 Years
The most you can lose on any stock (assuming you don't use leverage) is 100% of your money. But when you pick a company that is really flourishing, you can make more than 100%. For example, the APi Group Corporation (NYSE:APG) share price has soared 268% in the last half decade. Most would be very happy with that. The last week saw the share price soften some 4.7%.
任何股票(假設您不使用槓桿)最多可以虧損100%的資金。但是當您選擇一家真正蒸蒸日上的公司時,您可以賺到超過100%的收益。例如,APi Group Corporation(紐交所:APG)的股票價格在過去的半個十年中飆升了268%。大多數人對此會非常滿意。最近一週,股價有所回落,下跌了4.7%。
Since the long term performance has been good but there's been a recent pullback of 4.7%, let's check if the fundamentals match the share price.
由於長期表現良好,但最近出現了4.7%的回撤,讓我們來檢查一下基本面是否與股價相符。
In his essay The Superinvestors of Graham-and-Doddsville Warren Buffett described how share prices do not always rationally reflect the value of a business. By comparing earnings per share (EPS) and share price changes over time, we can get a feel for how investor attitudes to a company have morphed over time.
禾倫·巴菲特在他的論文《格雷厄姆-道德斯維爾的超級投資者》中描述了股票價格並不總是合理地反映企業的價值。通過比較每股收益(EPS)和股價隨時間變化的變化,我們可以了解到投資者對某家公司的態度如何隨時間而變化。
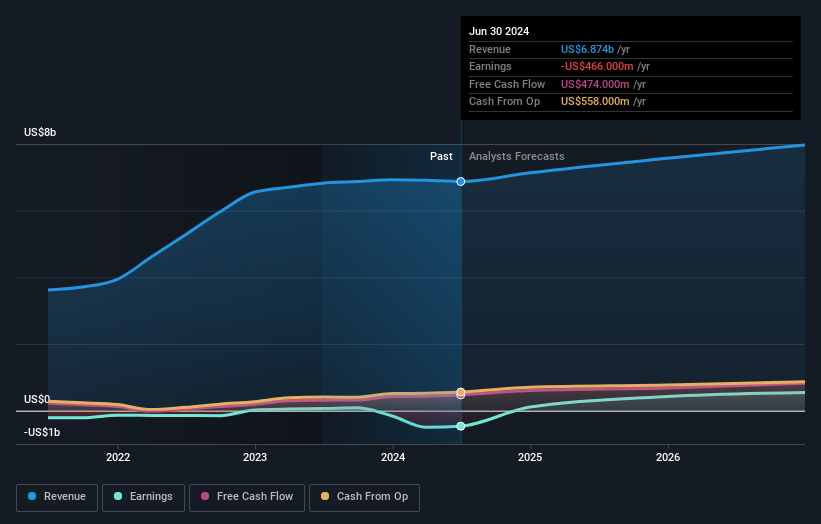
During five years of share price growth, APi Group moved from a loss to profitability. On the other hand, it reported a trailing twelve months loss, suggesting it isn't reliably profitable. So we might find other metrics can better explain the share price movements.
在股價增長的五年中,APi Group從虧損轉爲盈利。另一方面,根據最近十二個月的數據,公司報告了虧損,這意味着其盈利能力不穩定。因此,我們可能會發現其他指標可以更好地解釋股價的變動。
It is not great to see that revenue has dropped by per year over five years. So it seems one might have to take closer look at earnings and revenue trends to see how they might influence the share price.
很不好地看到營業收入在過去五年中每年下降了%。所以,似乎需要更仔細地看待收益和營業收入的趨勢,以了解它們如何影響股價。
You can see how earnings and revenue have changed over time in the image below (click on the chart to see the exact values).
你可以在下面的圖片中看到收入和營業收入隨時間的變化情況(單擊圖表可查看精確值)。
You can see how its balance sheet has strengthened (or weakened) over time in this free interactive graphic.
你可以在這個免費的互動圖表中看到它的資產負債表如何隨着時間的推移而加強(或削弱)。
A Different Perspective
不同的觀點
APi Group shareholders have received returns of 23% over twelve months, which isn't far from the general market return. We should note here that the five-year TSR is more impressive, at 30% per year. Although the share price growth has slowed, the longer term story points to a business well worth watching. I find it very interesting to look at share price over the long term as a proxy for business performance. But to truly gain insight, we need to consider other information, too. Take risks, for example - APi Group has 1 warning sign we think you should be aware of.
APi Group 股東在過去十二個月中獲得了23%的回報,與整體市場回報差距不大。我們需要指出的是,五年的TSR年均30%,更具吸引力。儘管股價增長有所放緩,長期來看,這個企業的發展勢頭看起來非常值得關注。作爲業務績效的代理,我對股價的長期走勢非常感興趣。但爲了真正獲得洞察力,我們還需要考慮其他的信息。比如承擔風險——APi Group有1個警告標誌,我們認爲你應該了解。
We will like APi Group better if we see some big insider buys. While we wait, check out this free list of undervalued stocks (mostly small caps) with considerable, recent, insider buying.
如果我們看到一些重大內部買入行爲,我們會更喜歡 APi Group。在等待期間,可以查看這份免費的被低估股票(主要是小市值股票)與近期有大量內部購買的公司名單。
Please note, the market returns quoted in this article reflect the market weighted average returns of stocks that currently trade on American exchanges.
請注意,本文所引述的市場回報反映了目前在美國交易所上市的股票的市場加權平均回報。
Have feedback on this article? Concerned about the content? Get in touch with us directly. Alternatively, email editorial-team (at) simplywallst.com.
This article by Simply Wall St is general in nature. We provide commentary based on historical data and analyst forecasts only using an unbiased methodology and our articles are not intended to be financial advice. It does not constitute a recommendation to buy or sell any stock, and does not take account of your objectives, or your financial situation. We aim to bring you long-term focused analysis driven by fundamental data. Note that our analysis may not factor in the latest price-sensitive company announcements or qualitative material. Simply Wall St has no position in any stocks mentioned.
對本文有任何反饋?對內容有任何疑慮?請直接與我們聯繫。或者,發送電子郵件至editorial-team@simplywallst.com。
這篇文章是Simply Wall St的一般性文章。我們根據歷史數據和分析師預測提供評論,只使用公正的方法論,我們的文章並不意味着提供任何金融建議。文章不構成買賣任何股票的建議,也不考慮您的目標或您的財務狀況。我們的目標是帶給您基本數據驅動的長期關注分析。請注意,我們的分析可能不考慮最新的價格敏感公司公告或定性材料。Simply Wall St沒有任何股票頭寸。
譯文內容由第三人軟體翻譯。