
Does PTC (NASDAQ:PTC) Have A Healthy Balance Sheet?
Does PTC (NASDAQ:PTC) Have A Healthy Balance Sheet?
 We can see from the most recent balance sheet that PTC had liabilities of US$1.57b falling due within a year, and liabilities of US$1.54b due beyond that. Offsetting this, it had US$247.7m in cash and US$675.0m in receivables that were due within 12 months. So it has liabilities totalling US$2.19b more than its cash and near-term receivables, combined.
 Warren Buffett famously said, 'Volatility is far from synonymous with risk.' It's only natural to consider a company's balance sheet when you examine how risky it is, since debt is often involved when a business collapses. Importantly, PTC Inc. (NASDAQ:PTC) does carry debt. But should shareholders be worried about its use of debt?
禾倫·巴菲特曾經說過:「波動性和風險遠非同義詞。」在評估風險時,考慮到公司的資產負債表是非常自然的,因爲當一家企業倒閉時通常都涉及債務。重要的是,PTC公司(納斯達克代碼:PTC)確實有債務負擔。但是股東們應該擔心它使用債務的情況嗎?
When Is Debt Dangerous?
債務何時有危險?
Debt and other liabilities become risky for a business when it cannot easily fulfill those obligations, either with free cash flow or by raising capital at an attractive price. Part and parcel of capitalism is the process of 'creative destruction' where failed businesses are mercilessly liquidated by their bankers. However, a more common (but still painful) scenario is that it has to raise new equity capital at a low price, thus permanently diluting shareholders. Having said that, the most common situation is where a company manages its debt reasonably well - and to its own advantage. When we examine debt levels, we first consider both cash and debt levels, together.
當企業無法用自由現金流或以有吸引力的價格籌集資本來輕鬆履行這些義務時,債務和其他負債就會成爲業務風險。資本主義的支柱是「創造性破壞」的過程,商業失敗者會被銀行家無情地清算。然而,一個更普遍的(但仍然令人痛苦的)情況是,公司必須以低價格籌集新的股本資本,從而永久性地稀釋股東。話雖如此,最常見的情況是公司合理地管理其債務並受益於其債務。當我們檢查債務水平時,我們首先考慮現金和債務水平,以及二者一起。
How Much Debt Does PTC Carry?
PTC承載了多少債務?
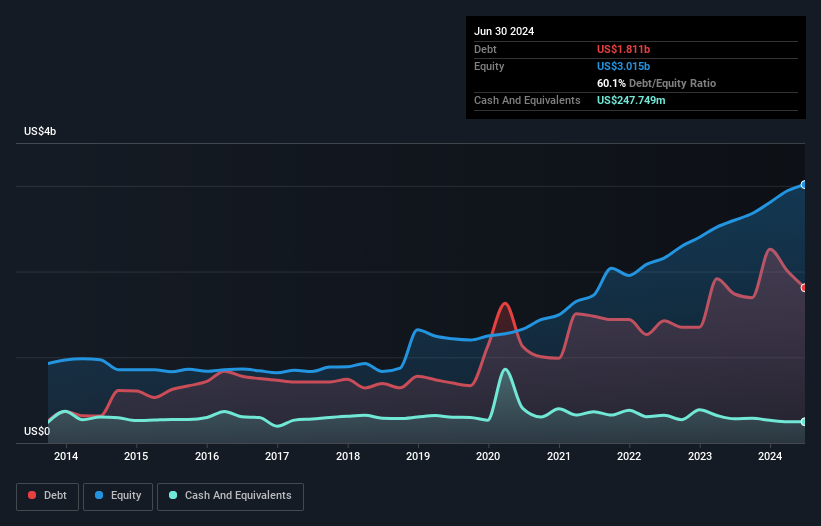
As you can see below, at the end of June 2024, PTC had US$1.81b of debt, up from US$1.74b a year ago. Click the image for more detail. However, it also had US$247.7m in cash, and so its net debt is US$1.56b.
正如您可以在下面看到的,截至2024年6月底,PTC的債務爲18.1億美元,比一年前的17.4億美元增長。請點擊圖片了解更多詳細信息。然而,它還有2477萬美元的現金,因此淨債務爲15.6億美元。
How Strong Is PTC's Balance Sheet?
PTC的資產負債表有多堅實?
We can see from the most recent balance sheet that PTC had liabilities of US$1.57b falling due within a year, and liabilities of US$1.54b due beyond that. Offsetting this, it had US$247.7m in cash and US$675.0m in receivables that were due within 12 months. So it has liabilities totalling US$2.19b more than its cash and near-term receivables, combined.
我們可以從最近的資產負債表看到,PTC有15.7億美元的一年內到期的負債,以及15.4億美元的到期負債。除此之外,它擁有2.477億美元的現金和6.75億美元的應收賬款,這些應收賬款在12個月內到期。因此,它的債務總額比其現金和近期應收賬款加起來多出21.9億美元。
Of course, PTC has a titanic market capitalization of US$21.5b, so these liabilities are probably manageable. But there are sufficient liabilities that we would certainly recommend shareholders continue to monitor the balance sheet, going forward.
當然,PTC的市值達215億美元,所以這些負債可能是可以管理的。但是有足夠的負債,我們一定會建議股東繼續關注資產負債表的變化。
We use two main ratios to inform us about debt levels relative to earnings. The first is net debt divided by earnings before interest, tax, depreciation, and amortization (EBITDA), while the second is how many times its earnings before interest and tax (EBIT) covers its interest expense (or its interest cover, for short). Thus we consider debt relative to earnings both with and without depreciation and amortization expenses.
我們使用兩個主要的比率來告訴我們相對於收益的債務水平。第一個是淨債務除以利息、稅、折舊和攤銷前利潤(EBITDA),而第二個是其利潤前利息和稅(EBIT)覆蓋其利息費用的次數(或其利息覆蓋率,簡稱)。因此,我們考慮與折舊和攤銷費用相關的盈利以及沒有相關費用的盈利相對於債務水平。
PTC has a debt to EBITDA ratio of 2.6 and its EBIT covered its interest expense 4.1 times. Taken together this implies that, while we wouldn't want to see debt levels rise, we think it can handle its current leverage. Fortunately, PTC grew its EBIT by 2.8% in the last year, slowly shrinking its debt relative to earnings. The balance sheet is clearly the area to focus on when you are analysing debt. But ultimately the future profitability of the business will decide if PTC can strengthen its balance sheet over time. So if you want to see what the professionals think, you might find this free report on analyst profit forecasts to be interesting.
PTC的債務與EBITDA比率爲2.6,其EBIT覆蓋了利息開支的3倍。總體而言,這意味着,雖然我們不希望看到債務水平上升,但我們認爲它可以應對當前的槓桿。幸運的是,PTC在過去一年中將其EBIT增長了2.8%,相對收入而言,其債務在逐漸減少。在分析債務時,資產負債表顯然是需要重點關注的領域。但最終,業務未來的盈利能力將決定PTC是否能夠隨着時間的推移加強其資產負債表。因此,如果您想了解專業人士的看法,您可能會對分析師盈利預測的免費報告感興趣。
But our final consideration is also important, because a company cannot pay debt with paper profits; it needs cold hard cash. So we clearly need to look at whether that EBIT is leading to corresponding free cash flow. Over the last three years, PTC actually produced more free cash flow than EBIT. That sort of strong cash generation warms our hearts like a puppy in a bumblebee suit.
但我們的最終考慮也很重要,因爲一家公司不能用虛擬利潤來償還債務;它需要現金。因此,我們顯然需要觀察EBIT是否導致相應的自由現金流。在過去三年中,PTC實際上產生的自由現金流比EBIT還要多。這種強勁的現金生成力就像穿着蜜蜂服的小狗一樣溫暖我們的心。
Our View
我們的觀點
Happily, PTC's impressive conversion of EBIT to free cash flow implies it has the upper hand on its debt. But, on a more sombre note, we are a little concerned by its interest cover. Looking at all the aforementioned factors together, it strikes us that PTC can handle its debt fairly comfortably. On the plus side, this leverage can boost shareholder returns, but the potential downside is more risk of loss, so it's worth monitoring the balance sheet. The balance sheet is clearly the area to focus on when you are analysing debt. However, not all investment risk resides within the balance sheet - far from it. Be aware that PTC is showing 2 warning signs in our investment analysis , you should know about...
PTC的卓越的EBIt轉自由現金流的能力使其在債務方面佔優勢。但是,值得注意的是,我們對其利息覆蓋率有些擔憂。綜合考慮所有上述因素,我們認爲PTC可以相當舒適地處理其債務。好的方面是,這種槓桿可以提高股東回報,但潛在的不利因素是更高的損失風險,因此值得監控資產負債表。當您分析債務時,平衡表顯然是要重點關注的領域。然而,並不是所有的投資風險都存在於資產負債表中——遠非如此。請注意,PTC在我們的投資分析中顯示了2個警告信號,您應該了解...。
If, after all that, you're more interested in a fast growing company with a rock-solid balance sheet, then check out our list of net cash growth stocks without delay.
如果在所有這些之後,您更感興趣的是具有堅實資產負債表的快速增長公司,那麼不要拖延,查看我們的淨現金增長股票列表。
Have feedback on this article? Concerned about the content? Get in touch with us directly. Alternatively, email editorial-team (at) simplywallst.com.
This article by Simply Wall St is general in nature. We provide commentary based on historical data and analyst forecasts only using an unbiased methodology and our articles are not intended to be financial advice. It does not constitute a recommendation to buy or sell any stock, and does not take account of your objectives, or your financial situation. We aim to bring you long-term focused analysis driven by fundamental data. Note that our analysis may not factor in the latest price-sensitive company announcements or qualitative material. Simply Wall St has no position in any stocks mentioned.
對本文有任何反饋?對內容有任何疑慮?請直接與我們聯繫。或者,發送電子郵件至editorial-team@simplywallst.com。
這篇文章是Simply Wall St的一般性文章。我們根據歷史數據和分析師預測提供評論,只使用公正的方法論,我們的文章並不意味着提供任何金融建議。文章不構成買賣任何股票的建議,也不考慮您的目標或您的財務狀況。我們的目標是帶給您基本數據驅動的長期關注分析。請注意,我們的分析可能不考慮最新的價格敏感公司公告或定性材料。Simply Wall St沒有任何股票頭寸。
譯文內容由第三人軟體翻譯。
