
LivaNova PLC (NASDAQ:LIVN) Shares Could Be 36% Below Their Intrinsic Value Estimate
LivaNova PLC (NASDAQ:LIVN) Shares Could Be 36% Below Their Intrinsic Value Estimate
 A DCF is all about the idea that a dollar in the future is less valuable than a dollar today, and so the sum of these future cash flows is then discounted to today's value:
 Key Insights
主要見解
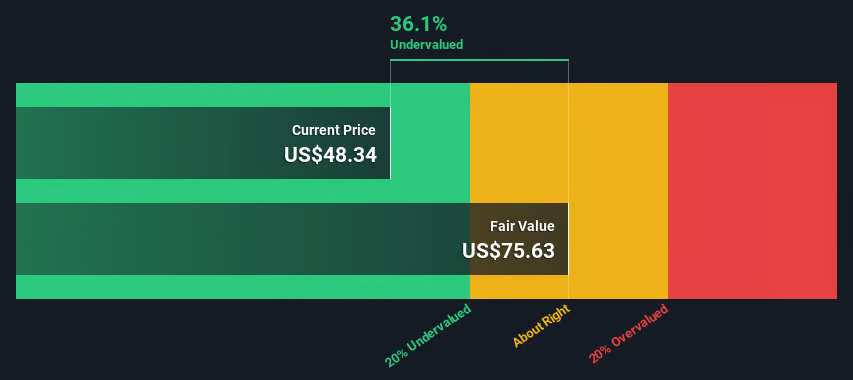
- The projected fair value for LivaNova is US$75.63 based on 2 Stage Free Cash Flow to Equity
- LivaNova's US$48.34 share price signals that it might be 36% undervalued
- Analyst price target for LIVN is US$68.90 which is 8.9% below our fair value estimate
- LivaNova的預測公允價值爲75.63美元,基於2階段自由現金流到股本
- LivaNova的48.34美元的股價表明它可能被低估了36%
- LIVN的分析師目標價爲68.90美元,低於我們的公允價值估計8.9%
Does the August share price for LivaNova PLC (NASDAQ:LIVN) reflect what it's really worth? Today, we will estimate the stock's intrinsic value by taking the expected future cash flows and discounting them to today's value. Our analysis will employ the Discounted Cash Flow (DCF) model. It may sound complicated, but actually it is quite simple!
8月份LivaNova PLC(NASDAQ:LIVN)的股價是否反映了它真正的價值?今天,我們將通過將預期未來現金流折現到現值來估計股票的內在價值。我們的分析將使用折現現金流量(DCF)模型。聽起來可能很複雜,但實際上它非常簡單!
We would caution that there are many ways of valuing a company and, like the DCF, each technique has advantages and disadvantages in certain scenarios. If you want to learn more about discounted cash flow, the rationale behind this calculation can be read in detail in the Simply Wall St analysis model.
我們要警告的是,有很多方法來對公司進行估值,就像DCF一樣,每種技術在某些情況下都有優點和缺點。如果您想了解更多關於折現現金流的信息,可以在Simply Wall St分析模型中詳細閱讀這個計算背後的推理。
The Method
方法
We're using the 2-stage growth model, which simply means we take in account two stages of company's growth. In the initial period the company may have a higher growth rate and the second stage is usually assumed to have a stable growth rate. To start off with, we need to estimate the next ten years of cash flows. Where possible we use analyst estimates, but when these aren't available we extrapolate the previous free cash flow (FCF) from the last estimate or reported value. We assume companies with shrinking free cash flow will slow their rate of shrinkage, and that companies with growing free cash flow will see their growth rate slow, over this period. We do this to reflect that growth tends to slow more in the early years than it does in later years.
我們正在使用2階段增長模型,這意味着我們考慮公司的兩個增長階段。在最初的階段,公司可能具有更高的增長率,第二階段通常假定具有穩定的增長率。首先,我們需要估計未來十年的現金流。如果有可能,我們使用分析師的估計,但當這些估計不可獲得時,我們會利用上一個自由現金流(FCF)的估計或報告的價值進行推算。我們假設自由現金流不斷萎縮的公司將會減緩萎縮速度,而流動自由現金不斷增長的公司將會在此期間看到其增長率放緩。我們這樣做是爲了反映增長趨勢在早期年份比後期年份更容易放緩。
A DCF is all about the idea that a dollar in the future is less valuable than a dollar today, and so the sum of these future cash flows is then discounted to today's value:
DCF的核心概念是未來的每一美元都比現在的每一美元更不值錢,因此我們將這些未來的現金流貼現到當今的價值:
10-year free cash flow (FCF) forecast
10年自由現金流(FCF)預測
| 2025 | 2026 | 2027 | 2028 | 2029 | 2030 | 2031 | 2032 | 2033 | 2034 | |
| Levered FCF ($, Millions) | US$476.0m | US$299.0m | US$488.0m | US$252.0m | US$231.4m | US$219.9m | US$213.9m | US$211.4m | US$211.2m | US$212.7m |
| Growth Rate Estimate Source | Analyst x1 | Analyst x1 | Analyst x1 | Analyst x1 | Est @ -8.18% | Est @ -4.98% | Est @ -2.73% | Est @ -1.16% | Est @ -0.06% | Est @ 0.70% |
| Present Value ($, Millions) Discounted @ 7.6% | US$442 | US$258 | US$392 | US$188 | US$161 | US$142 | US$128 | US$118 | US$109 | US$102 |
| 2025 | 2026 | 2027 | 2028 | 2029 | 2030 | 2031 | 2032 | 2033 | 2034 | |
| 槓桿自由現金流 ($, 百萬) | 估計@ -4.98% | 2.99億美元 | 2.52億美元 | Est @ 0.70% | Present Value ($萬s) Discounted @ 7.6% | US$109 | 211.4百萬美元 | ("Est" = FCF growth rate estimated by Simply Wall St) | 現在我們需要計算終值,該值考慮了這十年期之後的所有未來現金流。由於很多原因,使用了一個非常保守的增長率,該增長率不能超過一個國家的GDP增長率。在這種情況下,我們使用了10年期政府債券收益率的5年平均值(2.5%)來估計未來的增長。與10年期「增長」期的情況一樣,我們將未來的現金流折現到今天的價值,使用的是股權成本率爲7.6%。 | |
| 增長率估計來源 | 分析師x1 | 分析師x1 | 分析師x1 | 分析師x1 | 估計爲-8.18% | Other High Quality Alternatives: Do you like a good all-rounder? Explore our interactive list of high quality stocks to get an idea of what else is out there you may be missing! | 以-2.73%的估值爲基礎 | 預計@-0.06% | 預計增長率爲0.70% | |
| 以7.6%的貼現率貼現後的現值(百萬美元)。 | 442美元 | 美元258 | US $ 392 | 美元188 | 161美元 | 美元142 | 128百萬美元 | 118美元 | 美元109 | 102美元 |
("Est" = FCF growth rate estimated by Simply Wall St)
Present Value of 10-year Cash Flow (PVCF) = US$2.0b
("Est" = Simply Wall St 估計的自由現金流增長率)
10年現金流的現值(PVCF) = 20億美元
We now need to calculate the Terminal Value, which accounts for all the future cash flows after this ten year period. For a number of reasons a very conservative growth rate is used that cannot exceed that of a country's GDP growth. In this case we have used the 5-year average of the 10-year government bond yield (2.5%) to estimate future growth. In the same way as with the 10-year 'growth' period, we discount future cash flows to today's value, using a cost of equity of 7.6%.
Terminal Value (TV)= FCF2034 × (1 + g) ÷ (r – g) = US$213m× (1 + 2.5%) ÷ (7.6%– 2.5%) = US$4.3b
Present Value of Terminal Value (PVTV)= TV / (1 + r)10= US$4.3b÷ ( 1 + 7.6%)10= US$2.1b
The total value is the sum of cash flows for the next ten years plus the discounted terminal value, which results in the Total Equity Value, which in this case is US$4.1b. In the final step we divide the equity value by the number of shares outstanding. Compared to the current share price of US$48.3, the company appears quite undervalued at a 36% discount to where the stock price trades currently. The assumptions in any calculation have a big impact on the valuation, so it is better to view this as a rough estimate, not precise down to the last cent.
Important Assumptions
重要假設
The calculation above is very dependent on two assumptions. The first is the discount rate and the other is the cash flows. You don't have to agree with these inputs, I recommend redoing the calculations yourself and playing with them. The DCF also does not consider the possible cyclicality of an industry, or a company's future capital requirements, so it does not give a full picture of a company's potential performance. Given that we are looking at LivaNova as potential shareholders, the cost of equity is used as the discount rate, rather than the cost of capital (or weighted average cost of capital, WACC) which accounts for debt. In this calculation we've used 7.6%, which is based on a levered beta of 1.048. Beta is a measure of a stock's volatility, compared to the market as a whole. We get our beta from the industry average beta of globally comparable companies, with an imposed limit between 0.8 and 2.0, which is a reasonable range for a stable business.
Next Steps:
下一步:
Although the valuation of a company is important, it is only one of many factors that you need to assess for a company. DCF models are not the be-all and end-all of investment valuation. Rather it should be seen as a guide to "what assumptions need to be true for this stock to be under/overvalued?" For instance, if the terminal value growth rate is adjusted slightly, it can dramatically alter the overall result. Can we work out why the company is trading at a discount to intrinsic value? For LivaNova, there are three important elements you should further research:
- Financial Health: Does LIVN have a healthy balance sheet? Take a look at our free balance sheet analysis with six simple checks on key factors like leverage and risk.
- Future Earnings: How does LIVN's growth rate compare to its peers and the wider market? Dig deeper into the analyst consensus number for the upcoming years by interacting with our free analyst growth expectation chart.
- Other High Quality Alternatives: Do you like a good all-rounder? Explore our interactive list of high quality stocks to get an idea of what else is out there you may be missing!
- 其他高質量選擇:你喜歡一個好的多面手嗎?瀏覽我們的高質量股票交互列表,了解還有哪些你可能錯過的好東西!
PS. Simply Wall St updates its DCF calculation for every American stock every day, so if you want to find the intrinsic value of any other stock just search here.
PS. Simply Wall St每天都會更新其對每隻美國股票的折現現金流計算,因此,如果你想找到其他股票的內在價值,只需在此搜索即可。
Have feedback on this article? Concerned about the content? Get in touch with us directly. Alternatively, email editorial-team (at) simplywallst.com.
This article by Simply Wall St is general in nature. We provide commentary based on historical data and analyst forecasts only using an unbiased methodology and our articles are not intended to be financial advice. It does not constitute a recommendation to buy or sell any stock, and does not take account of your objectives, or your financial situation. We aim to bring you long-term focused analysis driven by fundamental data. Note that our analysis may not factor in the latest price-sensitive company announcements or qualitative material. Simply Wall St has no position in any stocks mentioned.
對本文有任何反饋?對內容有任何疑慮?請直接與我們聯繫。或者,發送電子郵件至editorial-team@simplywallst.com。
這篇文章是Simply Wall St的一般性文章。我們根據歷史數據和分析師預測提供評論,只使用公正的方法論,我們的文章並不意味着提供任何金融建議。文章不構成買賣任何股票的建議,也不考慮您的目標或您的財務狀況。我們的目標是帶給您基本數據驅動的長期關注分析。請注意,我們的分析可能不考慮最新的價格敏感公司公告或定性材料。Simply Wall St沒有任何股票頭寸。
譯文內容由第三人軟體翻譯。