
Urban Outfitters' (NASDAQ:URBN) Earnings Growth Rate Lags the 10% CAGR Delivered to Shareholders
Urban Outfitters' (NASDAQ:URBN) Earnings Growth Rate Lags the 10% CAGR Delivered to Shareholders
 During five years of share price growth, Urban Outfitters achieved compound earnings per share (EPS) growth of 6.5% per year. This EPS growth is lower than the 10% average annual increase in the share price. So it's fair to assume the market has a higher opinion of the business than it did five years ago. That's not necessarily surprising considering the five-year track record of earnings growth.
 Urban Outfitters, Inc. (NASDAQ:URBN) shareholders have seen the share price descend 21% over the month. But at least the stock is up over the last five years. Unfortunately its return of 64% is below the market return of 106%.
Urban Outfitters, Inc.(納斯達克:URBN)股東在一個月內看到股價下跌了21%。但至少這支股票在過去五年中上漲了。不幸的是,它的回報率爲64%,低於106%的市場回報率。
While the stock has fallen 8.0% this week, it's worth focusing on the longer term and seeing if the stocks historical returns have been driven by the underlying fundamentals.
雖然股價本週下跌了8.0%,但值得關注的是長期趨勢,並看看股票的歷史回報是否受基本面的驅動。
To paraphrase Benjamin Graham: Over the short term the market is a voting machine, but over the long term it's a weighing machine. One imperfect but simple way to consider how the market perception of a company has shifted is to compare the change in the earnings per share (EPS) with the share price movement.
爲了概述本傑明·格雷厄姆(Benjamin Graham)的話:短期內,市場是一臺投票機,但長期來看,它是一臺衡重機。思考一家公司的市場感知如何轉變的一種不完美但簡單的方法是將每股收益(EPS)變化與股價變動進行比較。
During five years of share price growth, Urban Outfitters achieved compound earnings per share (EPS) growth of 6.5% per year. This EPS growth is lower than the 10% average annual increase in the share price. So it's fair to assume the market has a higher opinion of the business than it did five years ago. That's not necessarily surprising considering the five-year track record of earnings growth.
在股價增長的五年中,Urban Outfitters實現了每股收益(EPS)的複合年增長率爲6.5%。這一EPS增長率低於股價的平均年增長率10%。因此可以合理地假設市場對該企業的看法高於五年前。考慮到五年來的盈利增長記錄,這並不奇怪。
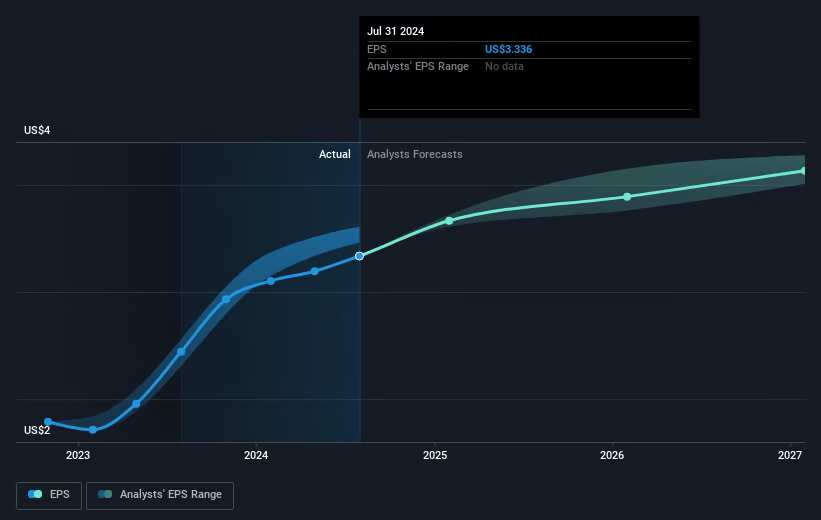
You can see below how EPS has changed over time (discover the exact values by clicking on the image).
下面可以看到每股收益隨時間的變化情況(通過點擊圖像來查看確切數值)。
It's probably worth noting that the CEO is paid less than the median at similar sized companies. It's always worth keeping an eye on CEO pay, but a more important question is whether the company will grow earnings throughout the years. Before buying or selling a stock, we always recommend a close examination of historic growth trends, available here..
值得注意的是,該公司的首席執行官的薪酬低於同等規模公司的中位數。關注首席執行官的薪酬一直是有必要的,但更重要的問題是該公司是否會在未來增加收益。在買入或賣出股票之前,我們始終建議仔細檢查歷史增長趨勢,並在此處進行了解。
A Different Perspective
不同的觀點
Urban Outfitters shareholders gained a total return of 11% during the year. But that was short of the market average. On the bright side, that's still a gain, and it's actually better than the average return of 10% over half a decade This suggests the company might be improving over time. It's always interesting to track share price performance over the longer term. But to understand Urban Outfitters better, we need to consider many other factors. Case in point: We've spotted 1 warning sign for Urban Outfitters you should be aware of.
都市服飾股東在今年獲得了總回報率爲11%。但這低於市場平均水平。不過,這仍然是一個收益,並且實際上優於過去半個世紀的10%的平均回報率,這表明公司可能會隨着時間而改善。跟蹤股價表現長期來看總是很有趣。但要更好地了解都市服飾,我們需要考慮許多其他因素。比如:我們發現了都市服飾的一個警示跡象,您應該注意。
If you are like me, then you will not want to miss this free list of undervalued small caps that insiders are buying.
如果您像我一樣,就不會希望錯過這份免費的內部人士正在購買的低估小市值股票列表。
Please note, the market returns quoted in this article reflect the market weighted average returns of stocks that currently trade on American exchanges.
請注意,本文所引述的市場回報反映了目前在美國交易所上市的股票的市場加權平均回報。
Have feedback on this article? Concerned about the content? Get in touch with us directly. Alternatively, email editorial-team (at) simplywallst.com.
This article by Simply Wall St is general in nature. We provide commentary based on historical data and analyst forecasts only using an unbiased methodology and our articles are not intended to be financial advice. It does not constitute a recommendation to buy or sell any stock, and does not take account of your objectives, or your financial situation. We aim to bring you long-term focused analysis driven by fundamental data. Note that our analysis may not factor in the latest price-sensitive company announcements or qualitative material. Simply Wall St has no position in any stocks mentioned.
對本文有任何反饋?對內容有任何疑慮?請直接與我們聯繫。或者,發送電子郵件至editorial-team@simplywallst.com。
這篇文章是Simply Wall St的一般性文章。我們根據歷史數據和分析師預測提供評論,只使用公正的方法論,我們的文章並不意味着提供任何金融建議。文章不構成買賣任何股票的建議,也不考慮您的目標或您的財務狀況。我們的目標是帶給您基本數據驅動的長期關注分析。請注意,我們的分析可能不考慮最新的價格敏感公司公告或定性材料。Simply Wall St沒有任何股票頭寸。
譯文內容由第三人軟體翻譯。