
#Gold Technical Analysis#24K99 News On Wednesday (August 28), during the Asian session, spot gold suddenly plummeted in the short term, and the current price of gold has fallen to around $2513 per ounce, a drop of more than $15 from the intraday high of $2529.04 per ounce. Valeria Bednarik, chief analyst at FXStreet, wrote an analysis of the technical outlook for gold.
Bednarik pointed out that gold continued the consolidation phase above $2500 per ounce. In the short term, gold is neutral to bullish, with bulls looking for opportunities to buy on dips.
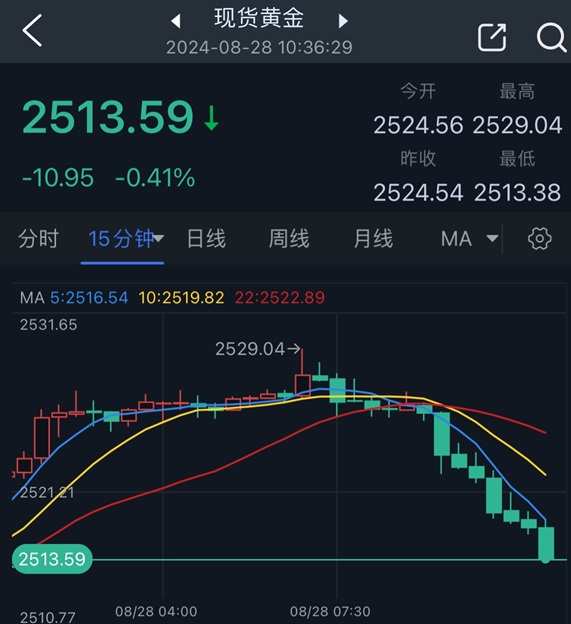
(Source: 24K99) 15-minute chart for spot gold.
On Tuesday, driven by the weakening US dollar, spot gold rose by 0.26% to close at $2524.54 per ounce; the price of gold fell to a daily low of $2503.28 per ounce.
Boosted by investors' optimism about the upcoming rate cut in the USA and lingering concerns about the Middle East conflict, the price of gold remains above the psychological level of $2500 per ounce, and is expected to have its best year since 2020.
Gold touched $2531.60 per ounce last week, setting a new historical high.
Investors are now awaiting Friday's US Personal Consumption Expenditures (PCE) price data, as this key inflation report is the favorite inflation indicator of the Federal Reserve.
According to CME's "FedWatch" tool, traders expect a 25 basis points rate cut in September with a probability of 63.5%, while the probability of a 50 basis points cut is around 36.5%.
Short-term technical outlook for gold
From a technical perspective, the trend of gold is still biased towards the upside. The daily chart shows that the price of gold continues to develop above all of its moving averages, with the 20-day Simple Moving Average (SMA) maintaining its upward slope, well above the bullish 100-day SMA and 200-day SMA. At the same time, the technical indicators have lost upward momentum but are consolidating near overbought levels, not indicating an imminent decline.
In the short term, the outlook for gold is neutral to bullish according to the 4-hour chart. The flat 20-period SMA continues to provide intraday support, while the 100-period SMA and 200-period SMA are moving higher, well below the current price of gold. However, the technical indicators are hovering above the midpoint without clear directional strength. The risk of a sharp decline in gold price seems limited, but a lack of progress could force some profit-taking and push the price below the key level of $2500 per ounce.
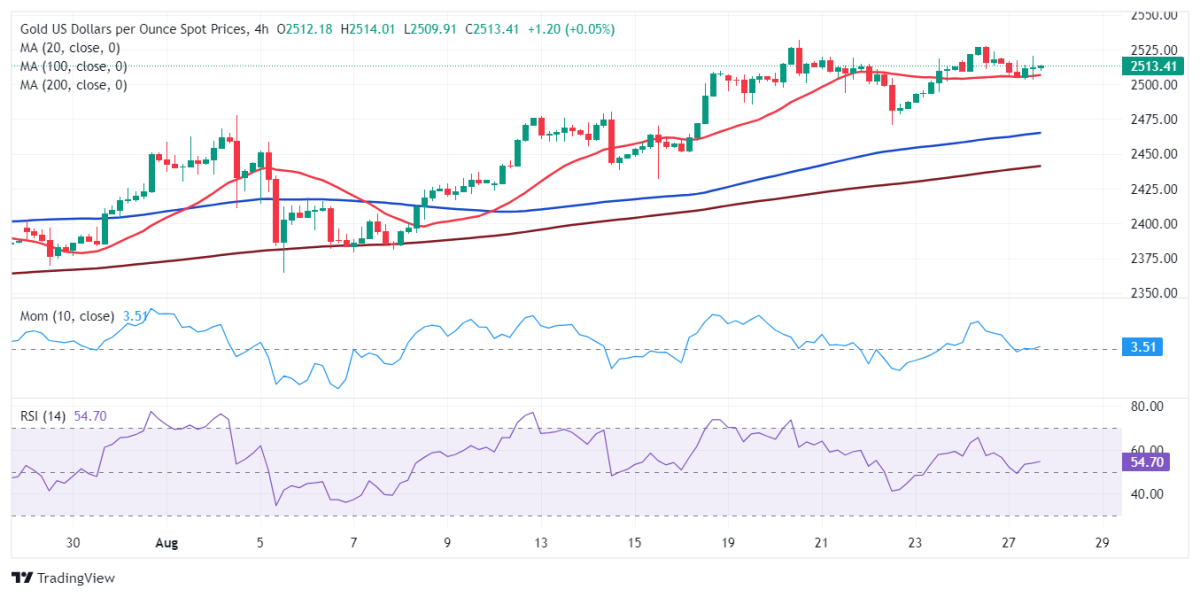
(Spot gold 4-hour chart source: FXStreet)
Bednarik gave the latest important support and resistance levels for the gold price:
Support levels: $2508.80 per ounce; $2496.40 per ounce; $2485.10 per ounce
Resistance level: $2523.50 per ounce; $2531.60 per ounce; $2542.00 per ounce.
At 10:36 Beijing time, spot gold is trading at $2513.59 per ounce.