
Those Who Invested in Visteon (NASDAQ:VC) Five Years Ago Are up 46%
Those Who Invested in Visteon (NASDAQ:VC) Five Years Ago Are up 46%
 During five years of share price growth, Visteon achieved compound earnings per share (EPS) growth of 46% per year. The EPS growth is more impressive than the yearly share price gain of 8% over the same period. Therefore, it seems the market has become relatively pessimistic about the company. The reasonably low P/E ratio of 5.11 also suggests market apprehension.
 When you buy and hold a stock for the long term, you definitely want it to provide a positive return. Furthermore, you'd generally like to see the share price rise faster than the market. But Visteon Corporation (NASDAQ:VC) has fallen short of that second goal, with a share price rise of 46% over five years, which is below the market return. Zooming in, the stock is actually down 27% in the last year.
當您長揸一隻股票時,肯定希望它能提供正收益。此外,您通常希望股票價格上漲速度超過市場。但納斯達克(NASDAQ)的偉世通公司(Visteon Corporation,NASDAQ:VC)在實現第二個目標方面稍有不足,股價在五年內上漲了46%,低於市場回報。進一步觀察,該股票在過去一年中實際下跌了27%。
So let's assess the underlying fundamentals over the last 5 years and see if they've moved in lock-step with shareholder returns.
因此,讓我們評估過去5年的基本面,看看它們是否和股東的回報率相符。
While the efficient markets hypothesis continues to be taught by some, it has been proven that markets are over-reactive dynamic systems, and investors are not always rational. By comparing earnings per share (EPS) and share price changes over time, we can get a feel for how investor attitudes to a company have morphed over time.
儘管一些人繼續教授有效市場假說,但已經證明市場是過度反應的動態系統,並且投資者並不總是理性的。通過比較每股收益(EPS)和股價的變化情況,我們可以了解投資者對公司的態度如何隨着時間變化而變化。
During five years of share price growth, Visteon achieved compound earnings per share (EPS) growth of 46% per year. The EPS growth is more impressive than the yearly share price gain of 8% over the same period. Therefore, it seems the market has become relatively pessimistic about the company. The reasonably low P/E ratio of 5.11 also suggests market apprehension.
在五年的股價增長中,偉世通公司實現了每年46%的複合每股收益(EPS)增長。而這個EPS增長顯得更加令人印象深刻,超過了同期8%的股價增長。因此,市場對該公司變得相對悲觀。相對較低的市盈率(P/E ratio)爲5.11也表明了市場的擔憂。
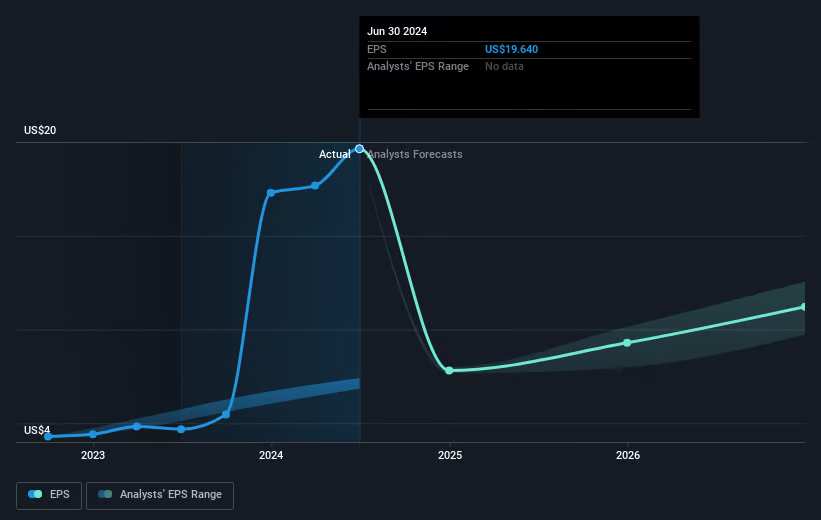
You can see below how EPS has changed over time (discover the exact values by clicking on the image).
下面可以看到每股收益隨時間的變化情況(通過點擊圖像來查看確切數值)。
We know that Visteon has improved its bottom line over the last three years, but what does the future have in store? This free interactive report on Visteon's balance sheet strength is a great place to start, if you want to investigate the stock further.
我們知道偉世通在過去的三年裏改善了盈利能力,但未來會怎樣呢?如果您想進一步調查該股票,這份免費互動報告關於偉世通的資產負債表實力是個好的起點。
A Different Perspective
不同的觀點
Investors in Visteon had a tough year, with a total loss of 27%, against a market gain of about 28%. However, keep in mind that even the best stocks will sometimes underperform the market over a twelve month period. On the bright side, long term shareholders have made money, with a gain of 8% per year over half a decade. It could be that the recent sell-off is an opportunity, so it may be worth checking the fundamental data for signs of a long term growth trend. While it is well worth considering the different impacts that market conditions can have on the share price, there are other factors that are even more important. Take risks, for example - Visteon has 3 warning signs (and 2 which make us uncomfortable) we think you should know about.
偉世通的投資者經歷了艱難的一年,總體虧損27%,而市場增長約28%。然而,請記住,即使是最好的股票有時也會在十二個月的時間內表現不佳。好消息是,長期股東已經賺到了錢,在過去五年中,年均收益率達到8%。最近的拋售可能是一個機會,因此值得檢查基本面數據以尋找長期增長趨勢的跡象。雖然考慮市場條件對股價的不同影響是很值得的,但其他因素更重要。以風險爲例 - 偉世通有3個警示信號(我們還有2個讓我們不舒服),我們認爲您應該了解。
If you are like me, then you will not want to miss this free list of undervalued small caps that insiders are buying.
如果您像我一樣,就不會希望錯過這份免費的內部人士正在購買的低估小市值股票列表。
Please note, the market returns quoted in this article reflect the market weighted average returns of stocks that currently trade on American exchanges.
請注意,本文所引述的市場回報反映了目前在美國交易所上市的股票的市場加權平均回報。
Have feedback on this article? Concerned about the content? Get in touch with us directly. Alternatively, email editorial-team (at) simplywallst.com.
This article by Simply Wall St is general in nature. We provide commentary based on historical data and analyst forecasts only using an unbiased methodology and our articles are not intended to be financial advice. It does not constitute a recommendation to buy or sell any stock, and does not take account of your objectives, or your financial situation. We aim to bring you long-term focused analysis driven by fundamental data. Note that our analysis may not factor in the latest price-sensitive company announcements or qualitative material. Simply Wall St has no position in any stocks mentioned.
對本文有任何反饋?對內容有任何疑慮?請直接與我們聯繫。或者,發送電子郵件至editorial-team@simplywallst.com。
這篇文章是Simply Wall St的一般性文章。我們根據歷史數據和分析師預測提供評論,只使用公正的方法論,我們的文章並不意味着提供任何金融建議。文章不構成買賣任何股票的建議,也不考慮您的目標或您的財務狀況。我們的目標是帶給您基本數據驅動的長期關注分析。請注意,我們的分析可能不考慮最新的價格敏感公司公告或定性材料。Simply Wall St沒有任何股票頭寸。
譯文內容由第三人軟體翻譯。