
MYR Group's (NASDAQ:MYRG) Earnings Growth Rate Lags the 29% CAGR Delivered to Shareholders
MYR Group's (NASDAQ:MYRG) Earnings Growth Rate Lags the 29% CAGR Delivered to Shareholders
MYR Group Inc. (NASDAQ:MYRG) shareholders might understandably be very concerned that the share price has dropped 34% in the last quarter. But that doesn't change the fact that the returns over the last five years have been very strong. Indeed, the share price is up an impressive 259% in that time. Generally speaking the long term returns will give you a better idea of business quality than short periods can. Of course, that doesn't necessarily mean it's cheap now.
MYR Group公司(納斯達克股票代碼:MYRG)的股東可能會對股價在上個季度下跌了34%感到擔憂。但這並不改變過去五年收益非常強勁的事實。事實上,在這段時間裏,股價上漲了令人印象深刻的259%。一般來說,長期回報會給你比短期更好的業務質量。當然,這並不一定意味着現在便宜。
Although MYR Group has shed US$71m from its market cap this week, let's take a look at its longer term fundamental trends and see if they've driven returns.
儘管MYR Group本週市值減少了7100萬美元,讓我們來看看其更長期的基本趨勢,看看它們是否推動了回報。
While the efficient markets hypothesis continues to be taught by some, it has been proven that markets are over-reactive dynamic systems, and investors are not always rational. One flawed but reasonable way to assess how sentiment around a company has changed is to compare the earnings per share (EPS) with the share price.
雖然一些人仍然在教授高效市場假說,但已經證明市場是過度反應的動態系統,投資者不總是理性的。一種有缺陷但合理的評估公司情緒變化的方法是比較每股收益 (EPS) 與股價。
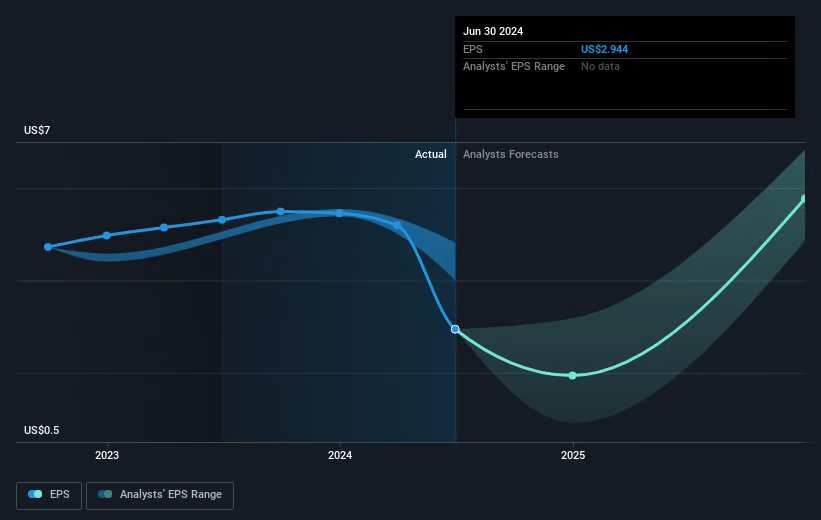
Over half a decade, MYR Group managed to grow its earnings per share at 8.2% a year. This EPS growth is slower than the share price growth of 29% per year, over the same period. So it's fair to assume the market has a higher opinion of the business than it did five years ago. That's not necessarily surprising considering the five-year track record of earnings growth.
在半個多世紀以來,MYR Group設法以每年8.2%的速度增長其每股收益。這種每股收益增長速度比同期股價增長速度29%每年要慢。因此,可以合理地假設市場對該業務的看法比五年前更高。考慮到過去五年盈利增長的紀錄,這並不奇怪。
You can see how EPS has changed over time in the image below (click on the chart to see the exact values).
您可以在下面的圖片中查看每股收益如何隨時間變化(單擊圖表以查看確切的價值)。
It's probably worth noting we've seen significant insider buying in the last quarter, which we consider a positive. On the other hand, we think the revenue and earnings trends are much more meaningful measures of the business. Dive deeper into the earnings by checking this interactive graph of MYR Group's earnings, revenue and cash flow.
值得注意的是,我們在上個季度看到了大量內部人員的買入行爲,這在我們看來是一個積極的信號。 另一方面,我們認爲營業收入和盈利趨勢才是業務更有意義的衡量標準。 通過查看MYR Group的盈利、營業收入和現金流的互動圖表,深入了解盈利情況。
A Different Perspective
不同的觀點
MYR Group shareholders are down 27% for the year, but the market itself is up 28%. However, keep in mind that even the best stocks will sometimes underperform the market over a twelve month period. Longer term investors wouldn't be so upset, since they would have made 29%, each year, over five years. It could be that the recent sell-off is an opportunity, so it may be worth checking the fundamental data for signs of a long term growth trend. While it is well worth considering the different impacts that market conditions can have on the share price, there are other factors that are even more important. To that end, you should be aware of the 1 warning sign we've spotted with MYR Group .
MYR Group的股東今年下跌了27%,但市場本身上漲了28%。 不過,請記住,即使最好的股票有時也會在十二個月的時間內表現不佳。 更長期的投資者將不會那麼沮喪,因爲在過去五年中,他們每年都賺取了29%。 最近的拋售可能是一個機會,因此值得檢查基本數據,以尋找長期增長趨勢的跡象。 雖然考慮市場條件對股價的影響非常重要,但還有其他更重要的因素。 爲此,您應該注意,我們已經發現了MYR Group的1個警示信號。
MYR Group is not the only stock insiders are buying. So take a peek at this free list of small cap companies at attractive valuations which insiders have been buying.
MYR Group並不是內部人員正在購買的唯一股票。 因此,查看此處有關小盤公司的免費列表,這些公司以具有吸引力的估值而聞名的內部人員一直在購買。
Please note, the market returns quoted in this article reflect the market weighted average returns of stocks that currently trade on American exchanges.
請注意,本文所引述的市場回報反映了目前在美國交易所上市的股票的市場加權平均回報。
Have feedback on this article? Concerned about the content? Get in touch with us directly. Alternatively, email editorial-team (at) simplywallst.com.
This article by Simply Wall St is general in nature. We provide commentary based on historical data and analyst forecasts only using an unbiased methodology and our articles are not intended to be financial advice. It does not constitute a recommendation to buy or sell any stock, and does not take account of your objectives, or your financial situation. We aim to bring you long-term focused analysis driven by fundamental data. Note that our analysis may not factor in the latest price-sensitive company announcements or qualitative material. Simply Wall St has no position in any stocks mentioned.
對本文有任何反饋?對內容有任何疑慮?請直接與我們聯繫。或者,發送電子郵件至editorial-team@simplywallst.com。
這篇文章是Simply Wall St的一般性文章。我們根據歷史數據和分析師預測提供評論,只使用公正的方法論,我們的文章並不意味着提供任何金融建議。文章不構成買賣任何股票的建議,也不考慮您的目標或您的財務狀況。我們的目標是帶給您基本數據驅動的長期關注分析。請注意,我們的分析可能不考慮最新的價格敏感公司公告或定性材料。Simply Wall St沒有任何股票頭寸。
譯文內容由第三人軟體翻譯。