
Those Who Invested in AECOM (NYSE:ACM) Five Years Ago Are up 198%
Those Who Invested in AECOM (NYSE:ACM) Five Years Ago Are up 198%
 During five years of share price growth, AECOM achieved compound earnings per share (EPS) growth of 14% per year. This EPS growth is slower than the share price growth of 24% per year, over the same period. So it's fair to assume the market has a higher opinion of the business than it did five years ago. And that's hardly shocking given the track record of growth.
 The worst result, after buying shares in a company (assuming no leverage), would be if you lose all the money you put in. But on the bright side, if you buy shares in a high quality company at the right price, you can gain well over 100%. One great example is AECOM (NYSE:ACM) which saw its share price drive 191% higher over five years. And in the last month, the share price has gained 8.2%. This could be related to the recent financial results that were recently released - you could check the most recent data by reading our company report.
購買公司股票後,最糟糕的結果(假設沒有槓桿)就是你投入的所有資金都虧損了。但好消息是,如果以正確的價格購買優質公司的股票,你可以獲得超過100%的回報。一個很好的例子是AECOm(NYSE:ACM),其股價在五年內上漲了191%。而在最近一個月,股價上漲了8.2%。這可能與最近發佈的財務業績有關-您可以通過閱讀我們的公司報告來查看最新數據。
So let's assess the underlying fundamentals over the last 5 years and see if they've moved in lock-step with shareholder returns.
因此,讓我們評估過去5年的基本面,看看它們是否和股東的回報率相符。
To paraphrase Benjamin Graham: Over the short term the market is a voting machine, but over the long term it's a weighing machine. One way to examine how market sentiment has changed over time is to look at the interaction between a company's share price and its earnings per share (EPS).
用本傑明·格雷厄姆的話來說:「短期市場是一臺投票機,但長期市場是一臺稱重機」。檢查市場情緒如何隨時間推移變化的一種方式是查看公司股價和每股收益(EPS)之間的相互作用。
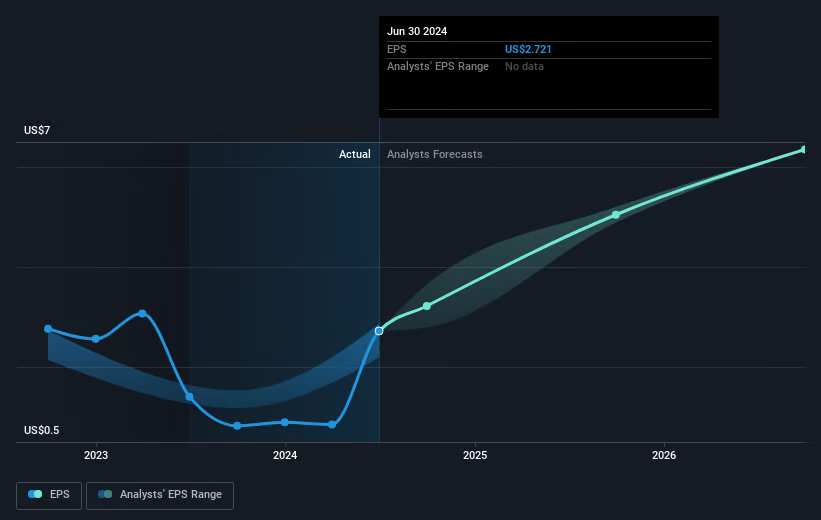
During five years of share price growth, AECOM achieved compound earnings per share (EPS) growth of 14% per year. This EPS growth is slower than the share price growth of 24% per year, over the same period. So it's fair to assume the market has a higher opinion of the business than it did five years ago. And that's hardly shocking given the track record of growth.
在五年的股價增長過程中,AECOm實現了每股收益(EPS)複合增長率爲14%。與同期每年24%的股價增長相比,這一EPS增長速度較慢。因此,可以合理地假設市場對該業務的看法高於五年前。鑑於其增長記錄,這並不奇怪。
The image below shows how EPS has tracked over time (if you click on the image you can see greater detail).
下圖顯示了EPS隨時間的變化情況(如果您單擊該圖像,則可以查看更多詳細信息)。
We know that AECOM has improved its bottom line lately, but is it going to grow revenue? Check if analysts think AECOM will grow revenue in the future.
我們知道AECOm最近改善了其淨利潤,但它是否會增加收入?請查看分析師是否認爲AECOm將來會增加收入。
What About Dividends?
那麼分紅怎麼樣呢?
As well as measuring the share price return, investors should also consider the total shareholder return (TSR). The TSR incorporates the value of any spin-offs or discounted capital raisings, along with any dividends, based on the assumption that the dividends are reinvested. So for companies that pay a generous dividend, the TSR is often a lot higher than the share price return. As it happens, AECOM's TSR for the last 5 years was 198%, which exceeds the share price return mentioned earlier. And there's no prize for guessing that the dividend payments largely explain the divergence!
除了衡量股價回報率之外,投資者還應考慮總股東回報率(TSR)。TSR包括任何分拆或折價增資的價值,以及任何分紅派息,假設分紅會被再投資。因此,對於支付豐厚分紅的公司,TSR通常比股價回報率高得多。恰好AECOM過去5年的TSR爲198%,超過了前面提到的股價回報率。沒有什麼獎勵可猜測,分紅派息在很大程度上解釋了這種分歧!
A Different Perspective
不同的觀點
AECOM shareholders are up 11% for the year (even including dividends). But that was short of the market average. On the bright side, the longer term returns (running at about 24% a year, over half a decade) look better. Maybe the share price is just taking a breather while the business executes on its growth strategy. I find it very interesting to look at share price over the long term as a proxy for business performance. But to truly gain insight, we need to consider other information, too. To that end, you should be aware of the 1 warning sign we've spotted with AECOM .
AECOm股東今年的回報率爲11%(包括分紅)。但這低於市場平均水平。令人振奮的是,長期回報(在過去的半個世紀裏每年約24%)看起來更好。也許股價只是在業務執行增長策略時稍事休整。對於將股價作爲業績代表的長期觀察,我覺得非常有趣。但要真正獲得洞察,我們還需要考慮其他信息。爲此,您應該注意我們發現的1個AECOm的預警信號。
For those who like to find winning investments this free list of undervalued companies with recent insider purchasing, could be just the ticket.
對於那些喜歡尋找獲勝投資的人來說,最近有內部購買的低估公司免費列表可能是一個很好的選擇。
Please note, the market returns quoted in this article reflect the market weighted average returns of stocks that currently trade on American exchanges.
請注意,本文所引述的市場回報反映了目前在美國交易所上市的股票的市場加權平均回報。
Have feedback on this article? Concerned about the content? Get in touch with us directly. Alternatively, email editorial-team (at) simplywallst.com.
This article by Simply Wall St is general in nature. We provide commentary based on historical data and analyst forecasts only using an unbiased methodology and our articles are not intended to be financial advice. It does not constitute a recommendation to buy or sell any stock, and does not take account of your objectives, or your financial situation. We aim to bring you long-term focused analysis driven by fundamental data. Note that our analysis may not factor in the latest price-sensitive company announcements or qualitative material. Simply Wall St has no position in any stocks mentioned.
對本文有任何反饋?對內容有任何疑慮?請直接與我們聯繫。或者,發送電子郵件至editorial-team@simplywallst.com。
這篇文章是Simply Wall St的一般性文章。我們根據歷史數據和分析師預測提供評論,只使用公正的方法論,我們的文章並不意味着提供任何金融建議。文章不構成買賣任何股票的建議,也不考慮您的目標或您的財務狀況。我們的目標是帶給您基本數據驅動的長期關注分析。請注意,我們的分析可能不考慮最新的價格敏感公司公告或定性材料。Simply Wall St沒有任何股票頭寸。
譯文內容由第三人軟體翻譯。
