
Those Who Invested in Manhattan Associates (NASDAQ:MANH) Five Years Ago Are up 207%
Those Who Invested in Manhattan Associates (NASDAQ:MANH) Five Years Ago Are up 207%
The most you can lose on any stock (assuming you don't use leverage) is 100% of your money. But on the bright side, if you buy shares in a high quality company at the right price, you can gain well over 100%. Long term Manhattan Associates, Inc. (NASDAQ:MANH) shareholders would be well aware of this, since the stock is up 207% in five years. It's also up 18% in about a month. We note that Manhattan Associates reported its financial results recently; luckily, you can catch up on the latest revenue and profit numbers in our company report.
您在任何一支股票上的最大虧損(假設您不使用槓桿)是您投入的資金的100%。但好的一面是,如果您以正確的價格購買高質量公司的股票,您可以獲得超過100%的收益。長期的manhattan associates股東們非常清楚這一點,因爲該股票在五年內上漲了207%。在大約一個月的時間裏也上漲了18%。我們注意到manhattan associates最近公佈了其財務業績,幸運的是,您可以在我們的公司報告中了解到最新的營業收入和利潤數據。
So let's assess the underlying fundamentals over the last 5 years and see if they've moved in lock-step with shareholder returns.
因此,讓我們評估過去5年的基本面,看看它們是否和股東的回報率相符。
While markets are a powerful pricing mechanism, share prices reflect investor sentiment, not just underlying business performance. By comparing earnings per share (EPS) and share price changes over time, we can get a feel for how investor attitudes to a company have morphed over time.
儘管市場是一個強大的定價機制,股價不僅反映了基本業務表現,還反映了投資者的情緒。通過比較每股收益(EPS)和股價變化,並隨時間推移這樣做,我們可以了解股東對公司的態度如何隨時間變化。
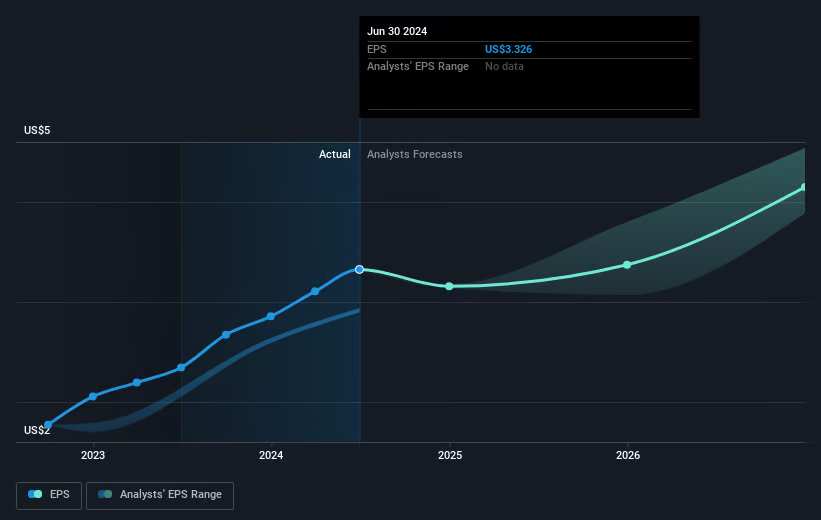
Over half a decade, Manhattan Associates managed to grow its earnings per share at 18% a year. This EPS growth is lower than the 25% average annual increase in the share price. This suggests that market participants hold the company in higher regard, these days. And that's hardly shocking given the track record of growth. This favorable sentiment is reflected in its (fairly optimistic) P/E ratio of 76.99.
在過去的五年中,manhattan associates年均每股收益增長了18%。這種每股收益的增長低於股價的25%平均年增長率。這表明市場參與者對該公司的評價更高,這並不奇怪,考慮到其增長記錄。這種積極的情緒在其(相當樂觀的)市盈率爲76.99中得到了體現。
The image below shows how EPS has tracked over time (if you click on the image you can see greater detail).
下圖顯示了EPS隨時間的變化情況(如果您單擊該圖像,則可以查看更多詳細信息)。
We know that Manhattan Associates has improved its bottom line lately, but is it going to grow revenue? This free report showing analyst revenue forecasts should help you figure out if the EPS growth can be sustained.
我們知道曼哈頓協會最近改善了其底線,但它是否會增加營業收入? 這份免費的報告顯示分析師的營收預測,應該能幫助你判斷EPS增長能否持續。
A Different Perspective
不同的觀點
It's good to see that Manhattan Associates has rewarded shareholders with a total shareholder return of 35% in the last twelve months. That's better than the annualised return of 25% over half a decade, implying that the company is doing better recently. Someone with an optimistic perspective could view the recent improvement in TSR as indicating that the business itself is getting better with time. It's always interesting to track share price performance over the longer term. But to understand Manhattan Associates better, we need to consider many other factors. Consider risks, for instance. Every company has them, and we've spotted 1 warning sign for Manhattan Associates you should know about.
很高興看到曼哈頓協會在過去12個月中回報股東35%的股東回報率。這比過去五年裏每年化的25%回報率要好,這意味着公司最近的表現更好。持樂觀態度者可以將近期TSR的改善視爲公司自身隨時間變得更好的指示。跟蹤股價在較長時間內的表現總是有趣的。但要更好地了解曼哈頓協會,我們需要考慮其他很多因素。考慮風險,例如。每家公司都有風險,我們發現曼哈頓協會有1個警示信號,你應該知道。
If you like to buy stocks alongside management, then you might just love this free list of companies. (Hint: many of them are unnoticed AND have attractive valuation).
如果您喜歡與管理層一起購買股票,那麼您可能會喜歡這個公司的免費列表。 (提示:其中許多公司不爲人注意且具有吸引力的估值。)
Please note, the market returns quoted in this article reflect the market weighted average returns of stocks that currently trade on American exchanges.
請注意,本文所引述的市場回報反映了目前在美國交易所上市的股票的市場加權平均回報。
Have feedback on this article? Concerned about the content? Get in touch with us directly. Alternatively, email editorial-team (at) simplywallst.com.
This article by Simply Wall St is general in nature. We provide commentary based on historical data and analyst forecasts only using an unbiased methodology and our articles are not intended to be financial advice. It does not constitute a recommendation to buy or sell any stock, and does not take account of your objectives, or your financial situation. We aim to bring you long-term focused analysis driven by fundamental data. Note that our analysis may not factor in the latest price-sensitive company announcements or qualitative material. Simply Wall St has no position in any stocks mentioned.
對本文有任何反饋?對內容有任何疑慮?請直接與我們聯繫。或者,發送電子郵件至editorial-team@simplywallst.com。
這篇文章是Simply Wall St的一般性文章。我們根據歷史數據和分析師預測提供評論,只使用公正的方法論,我們的文章並不意味着提供任何金融建議。文章不構成買賣任何股票的建議,也不考慮您的目標或您的財務狀況。我們的目標是帶給您基本數據驅動的長期關注分析。請注意,我們的分析可能不考慮最新的價格敏感公司公告或定性材料。Simply Wall St沒有任何股票頭寸。
譯文內容由第三人軟體翻譯。