
Investors in AptarGroup (NYSE:ATR) Have Seen Returns of 30% Over the Past Five Years
Investors in AptarGroup (NYSE:ATR) Have Seen Returns of 30% Over the Past Five Years
 During five years of share price growth, AptarGroup achieved compound earnings per share (EPS) growth of 7.0% per year. The EPS growth is more impressive than the yearly share price gain of 4% over the same period. So one could conclude that the broader market has become more cautious towards the stock.
 If you buy and hold a stock for many years, you'd hope to be making a profit. But more than that, you probably want to see it rise more than the market average. Unfortunately for shareholders, while the AptarGroup, Inc. (NYSE:ATR) share price is up 22% in the last five years, that's less than the market return. Over the last twelve months the stock price has risen a very respectable 19%.
如果您購買並持有一隻股票多年,希望能獲利。但更重要的是,您可能希望看到它的漲幅超過市場平均水平。不幸的是,對於股東而言,股票價格在過去五年中上漲了22%,但低於市場回報率。在過去的十二個月中,股票價格上漲了非常可觀的19%。
So let's investigate and see if the longer term performance of the company has been in line with the underlying business' progress.
那麼,讓我們調查一下並查看公司的長期表現是否符合基本業務的進展。
While the efficient markets hypothesis continues to be taught by some, it has been proven that markets are over-reactive dynamic systems, and investors are not always rational. One way to examine how market sentiment has changed over time is to look at the interaction between a company's share price and its earnings per share (EPS).
雖然有效市場假說仍然被一些人教授,但被證明市場是過度反應的動態系統,投資者並不總是理性的。檢查市場情緒如何隨時間變化的一種方法是看一個公司的股價與其每股收益(EPS)之間的交互作用。
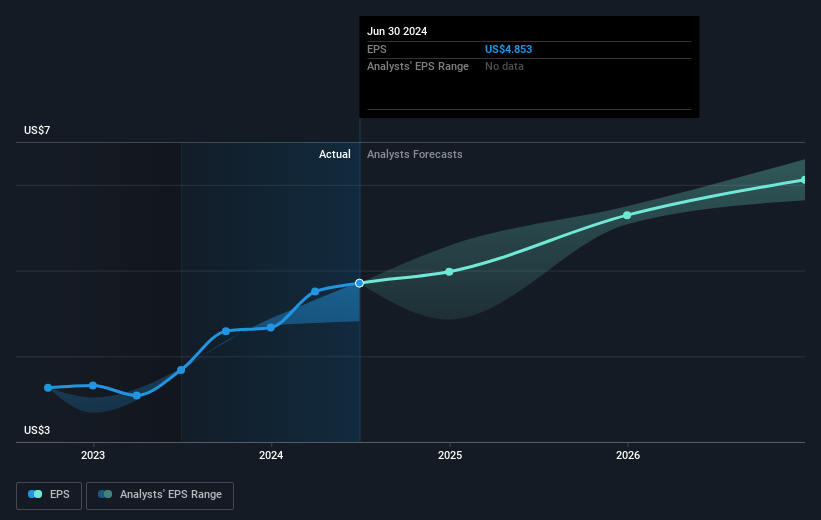
During five years of share price growth, AptarGroup achieved compound earnings per share (EPS) growth of 7.0% per year. The EPS growth is more impressive than the yearly share price gain of 4% over the same period. So one could conclude that the broader market has become more cautious towards the stock.
在五年的股票價格增長期間,AptarGroup每股收益複合增長率爲7.0%/年。而同期的年度股價增長4%,每股收益增長更爲出色。因此,可以得出更廣泛的市場對股票更加謹慎。
You can see how EPS has changed over time in the image below (click on the chart to see the exact values).
您可以在下面的圖片中查看每股收益如何隨時間變化(單擊圖表以查看確切的價值)。
We know that AptarGroup has improved its bottom line lately, but is it going to grow revenue? This free report showing analyst revenue forecasts should help you figure out if the EPS growth can be sustained.
我們知道AptarGroup的利潤增長最近有所改善,但它是否會增長營業收入呢?這份免費報告顯示分析師對營收的預測,有助於您了解每股收益增長能否持續。
What About Dividends?
那麼分紅怎麼樣呢?
When looking at investment returns, it is important to consider the difference between total shareholder return (TSR) and share price return. The TSR is a return calculation that accounts for the value of cash dividends (assuming that any dividend received was reinvested) and the calculated value of any discounted capital raisings and spin-offs. It's fair to say that the TSR gives a more complete picture for stocks that pay a dividend. As it happens, AptarGroup's TSR for the last 5 years was 30%, which exceeds the share price return mentioned earlier. The dividends paid by the company have thusly boosted the total shareholder return.
在考慮投資回報時,重要的是要考慮總股東回報(TSR)和股票價格回報之間的差異。TSR是一個回報計算,考慮到現金股息的價值(假設收到的任何股息都被再投資),以及任何折扣後的增資和分拆的計算價值。可以說,對於支付股息的股票,TSR提供了更完整的圖片。恰好,過去5年中AptarGroup的TSR爲30%,超過上述股票價格回報率。公司支付的股息也推高了總股東回報。
A Different Perspective
不同的觀點
AptarGroup shareholders are up 20% for the year (even including dividends). But that return falls short of the market. On the bright side, that's still a gain, and it's actually better than the average return of 5% over half a decade This could indicate that the company is winning over new investors, as it pursues its strategy. I find it very interesting to look at share price over the long term as a proxy for business performance. But to truly gain insight, we need to consider other information, too. To that end, you should be aware of the 1 warning sign we've spotted with AptarGroup .
即使包括股息,AptarGroup的股東今年的收益率也達到20%。但是這個回報率仍然不如市場。好在這仍然是一筆收益,並且比過去五年的平均回報率5%要好。這可能表明公司正在吸引新的投資者,同時推行其策略。我認爲,將股票價格作爲業績的代理觀察長期趨勢非常有趣。但要真正獲得洞察力,我們還需要考慮其他信息。爲此,您應該注意我們發現的一個警告信號。
For those who like to find winning investments this free list of undervalued companies with recent insider purchasing, could be just the ticket.
對於那些喜歡尋找獲勝投資的人來說,最近有內部購買的低估公司免費列表可能是一個很好的選擇。
Please note, the market returns quoted in this article reflect the market weighted average returns of stocks that currently trade on American exchanges.
請注意,本文所引述的市場回報反映了目前在美國交易所上市的股票的市場加權平均回報。
Have feedback on this article? Concerned about the content? Get in touch with us directly. Alternatively, email editorial-team (at) simplywallst.com.
This article by Simply Wall St is general in nature. We provide commentary based on historical data and analyst forecasts only using an unbiased methodology and our articles are not intended to be financial advice. It does not constitute a recommendation to buy or sell any stock, and does not take account of your objectives, or your financial situation. We aim to bring you long-term focused analysis driven by fundamental data. Note that our analysis may not factor in the latest price-sensitive company announcements or qualitative material. Simply Wall St has no position in any stocks mentioned.
對本文有任何反饋?對內容有任何疑慮?請直接與我們聯繫。或者,發送電子郵件至editorial-team@simplywallst.com。
這篇文章是Simply Wall St的一般性文章。我們根據歷史數據和分析師預測提供評論,只使用公正的方法論,我們的文章並不意味着提供任何金融建議。文章不構成買賣任何股票的建議,也不考慮您的目標或您的財務狀況。我們的目標是帶給您基本數據驅動的長期關注分析。請注意,我們的分析可能不考慮最新的價格敏感公司公告或定性材料。Simply Wall St沒有任何股票頭寸。
譯文內容由第三人軟體翻譯。
