
Alamo Group's (NYSE:ALG) Five-year Earnings Growth Trails the Decent Shareholder Returns
Alamo Group's (NYSE:ALG) Five-year Earnings Growth Trails the Decent Shareholder Returns
 During five years of share price growth, Alamo Group achieved compound earnings per share (EPS) growth of 10% per year. This EPS growth is remarkably close to the 10% average annual increase in the share price. This indicates that investor sentiment towards the company has not changed a great deal. Indeed, it would appear the share price is reacting to the EPS.
 When you buy and hold a stock for the long term, you definitely want it to provide a positive return. Better yet, you'd like to see the share price move up more than the market average. Unfortunately for shareholders, while the Alamo Group Inc. (NYSE:ALG) share price is up 59% in the last five years, that's less than the market return. Meanwhile, the last twelve months saw the share price rise 4.2%.
當你長揸一隻股票時,你肯定希望它能夠提供正向回報。更好的是,你希望它的股價上漲幅度超過市場平均水平。不幸的是,對於股東來說,儘管阿拉莫集團公司(NYSE:ALG)的股價在過去五年中上漲了59%,但這比市場回報率低。與此同時,過去12個月,股價上漲了4.2%。
Since it's been a strong week for Alamo Group shareholders, let's have a look at trend of the longer term fundamentals.
由於最近一週阿拉莫集團的股東表現不錯,讓我們來看看更長期的基本面趨勢。
To quote Buffett, 'Ships will sail around the world but the Flat Earth Society will flourish. There will continue to be wide discrepancies between price and value in the marketplace...' One way to examine how market sentiment has changed over time is to look at the interaction between a company's share price and its earnings per share (EPS).
引用巴菲特的話,「船隻會在世界各地航行,但扁平地球協會將空前盛行。市場上的價格和價值將繼續存在巨大差異… 」檢查市場情緒如何隨時間變化的一種方法是查看公司的股價與每股收益(EPS)之間的互動。
During five years of share price growth, Alamo Group achieved compound earnings per share (EPS) growth of 10% per year. This EPS growth is remarkably close to the 10% average annual increase in the share price. This indicates that investor sentiment towards the company has not changed a great deal. Indeed, it would appear the share price is reacting to the EPS.
在股價增長的五年期間,阿拉莫集團實現了每股收益(EPS)的複合增長率爲10%。這種EPS增長與股價每年10%的平均增長率非常接近。這表明投資者對該公司的情緒沒有太大改變。實際上,股價似乎正在對EPS做出反應。
You can see below how EPS has changed over time (discover the exact values by clicking on the image).
下面可以看到每股收益隨時間的變化情況(通過點擊圖像來查看確切數值)。
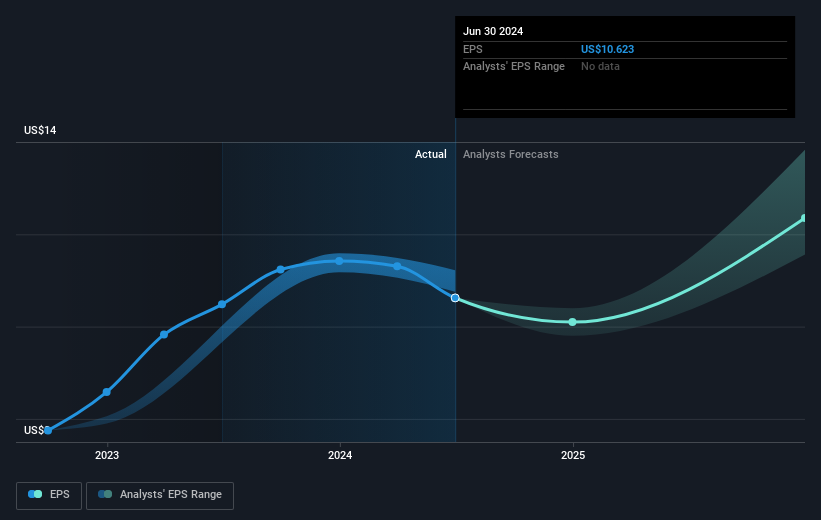
Dive deeper into Alamo Group's key metrics by checking this interactive graph of Alamo Group's earnings, revenue and cash flow.
通過檢查阿拉莫集團的收益,營業收入和現金流的交互式圖表,更深入地了解阿拉莫集團的關鍵指標非常重要。
What About Dividends?
那麼分紅怎麼樣呢?
It is important to consider the total shareholder return, as well as the share price return, for any given stock. The TSR incorporates the value of any spin-offs or discounted capital raisings, along with any dividends, based on the assumption that the dividends are reinvested. Arguably, the TSR gives a more comprehensive picture of the return generated by a stock. As it happens, Alamo Group's TSR for the last 5 years was 63%, which exceeds the share price return mentioned earlier. The dividends paid by the company have thusly boosted the total shareholder return.
對於任何給定的股票,重要的是考慮總股東回報以及股價回報。 TSR納入任何分拆或折價資本籌集的價值,以及除任何股息外,根據股息再投資的假設計算。可以說,TSR爲股票產生的回報提供了更全面的圖片。恰好,阿拉莫集團過去5年的TSR爲63%,超過了前面提到的股價回報。公司支付的股息已經提高了股東的總回報。
A Different Perspective
不同的觀點
Alamo Group shareholders gained a total return of 4.8% during the year. But that return falls short of the market. If we look back over five years, the returns are even better, coming in at 10% per year for five years. It's quite possible the business continues to execute with prowess, even as the share price gains are slowing. Most investors take the time to check the data on insider transactions. You can click here to see if insiders have been buying or selling.
阿拉莫集團的股東在今年獲得了總回報率爲4.8%。但是這個回報率仍然低於市場。如果我們回顧五年的情況,回報會更好,每年爲5年的10%。儘管股價的漲幅正在放緩,但公司可能仍在執行卓越的業務。大多數投資者都會花時間檢查內部交易數據。單擊此處以查看內部人員的購買或銷售情況。
If you like to buy stocks alongside management, then you might just love this free list of companies. (Hint: many of them are unnoticed AND have attractive valuation).
如果您喜歡與管理層一起購買股票,那麼您可能會喜歡這個公司的免費列表。 (提示:其中許多公司不爲人注意且具有吸引力的估值。)
Please note, the market returns quoted in this article reflect the market weighted average returns of stocks that currently trade on American exchanges.
請注意,本文所引述的市場回報反映了目前在美國交易所上市的股票的市場加權平均回報。
Have feedback on this article? Concerned about the content? Get in touch with us directly. Alternatively, email editorial-team (at) simplywallst.com.
This article by Simply Wall St is general in nature. We provide commentary based on historical data and analyst forecasts only using an unbiased methodology and our articles are not intended to be financial advice. It does not constitute a recommendation to buy or sell any stock, and does not take account of your objectives, or your financial situation. We aim to bring you long-term focused analysis driven by fundamental data. Note that our analysis may not factor in the latest price-sensitive company announcements or qualitative material. Simply Wall St has no position in any stocks mentioned.
對本文有任何反饋?對內容有任何疑慮?請直接與我們聯繫。或者,發送電子郵件至editorial-team@simplywallst.com。
這篇文章是Simply Wall St的一般性文章。我們根據歷史數據和分析師預測提供評論,只使用公正的方法論,我們的文章並不意味着提供任何金融建議。文章不構成買賣任何股票的建議,也不考慮您的目標或您的財務狀況。我們的目標是帶給您基本數據驅動的長期關注分析。請注意,我們的分析可能不考慮最新的價格敏感公司公告或定性材料。Simply Wall St沒有任何股票頭寸。
譯文內容由第三人軟體翻譯。