
The Five-year Loss for Olam Group (SGX:VC2) Shareholders Likely Driven by Its Shrinking Earnings
The Five-year Loss for Olam Group (SGX:VC2) Shareholders Likely Driven by Its Shrinking Earnings
 Looking back five years, both Olam Group's share price and EPS declined; the latter at a rate of 6.7% per year. This reduction in EPS is less than the 9% annual reduction in the share price. So it seems the market was too confident about the business, in the past.
 Olam Group Limited (SGX:VC2) shareholders should be happy to see the share price up 13% in the last week. But that doesn't change the fact that the returns over the last five years have been less than pleasing. You would have done a lot better buying an index fund, since the stock has dropped 36% in that half decade.
新加坡交易所Olam Group Limited (SGX:VC2)的股東應該會很高興,在過去的一週股價上漲了13%。但事實並沒有改變,過去五年的回報並不令人滿意。相比較而言,如果你購買一個指數基金,再好不過了,因爲這支股票在過去的五年中下跌了36%。
The recent uptick of 13% could be a positive sign of things to come, so let's take a look at historical fundamentals.
最近的13%上升趨勢可能是未來的積極跡象,因此讓我們來看看歷史基本面。
While the efficient markets hypothesis continues to be taught by some, it has been proven that markets are over-reactive dynamic systems, and investors are not always rational. One flawed but reasonable way to assess how sentiment around a company has changed is to compare the earnings per share (EPS) with the share price.
雖然一些人仍然在教授高效市場假說,但已經證明市場是過度反應的動態系統,投資者不總是理性的。一種有缺陷但合理的評估公司情緒變化的方法是比較每股收益 (EPS) 與股價。
Looking back five years, both Olam Group's share price and EPS declined; the latter at a rate of 6.7% per year. This reduction in EPS is less than the 9% annual reduction in the share price. So it seems the market was too confident about the business, in the past.
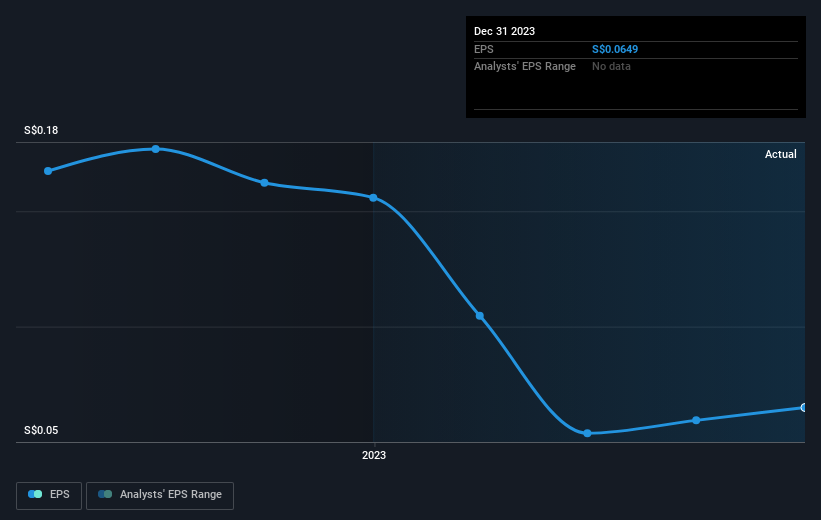
回顧過去五年,Olam Group的股價和每股收益均有下降;每股收益以年均6.7%的速度下降,而股價的降幅則高達9%。因此似乎市場在過去對企業過於自信。
The company's earnings per share (over time) is depicted in the image below (click to see the exact numbers).
該公司的每股收益(隨時間的推移)如下圖所示(單擊可查看確切數字)。
This free interactive report on Olam Group's earnings, revenue and cash flow is a great place to start, if you want to investigate the stock further.
如果你想進一步調查股票信息,這份免費互動報告關於Olam Group的盈利、收入和現金流是一個很好的起點。
What About Dividends?
那麼分紅怎麼樣呢?
It is important to consider the total shareholder return, as well as the share price return, for any given stock. The TSR is a return calculation that accounts for the value of cash dividends (assuming that any dividend received was reinvested) and the calculated value of any discounted capital raisings and spin-offs. It's fair to say that the TSR gives a more complete picture for stocks that pay a dividend. As it happens, Olam Group's TSR for the last 5 years was -14%, which exceeds the share price return mentioned earlier. And there's no prize for guessing that the dividend payments largely explain the divergence!
考慮到任何給定股票的總股東收益和股價收益是非常重要的。TSR是一種考慮到現金股息價值(假定任何收到的股息都進行了再投資)和任何折價資本籌集和剝離計算價值的回報計算方法。可以說,TSR爲支付股息的股票提供了更完整的圖片。Olam Group在過去的5年的TSR爲-14%,超過了之前提到的股價回報。毫無疑問,這種差異主要歸因於分紅派息!
A Different Perspective
不同的觀點
It's nice to see that Olam Group shareholders have received a total shareholder return of 4.3% over the last year. Of course, that includes the dividend. There's no doubt those recent returns are much better than the TSR loss of 3% per year over five years. We generally put more weight on the long term performance over the short term, but the recent improvement could hint at a (positive) inflection point within the business. I find it very interesting to look at share price over the long term as a proxy for business performance. But to truly gain insight, we need to consider other information, too. Consider for instance, the ever-present spectre of investment risk. We've identified 3 warning signs with Olam Group (at least 2 which can't be ignored) , and understanding them should be part of your investment process.
我們很高興地看到,過去一年Olam Group的股東獲得了4.3%的總股東回報。當然,其中包括股息。五年內每年的TSR損失3%,這些最近的回報顯然比短期內的表現要好得多,這可能暗示業務方面已經出現(積極的)拐點。我認爲通過長期股價作爲業務績效的代理來觀察具有很大的趣味性。但爲了獲得真正的見解,我們還需要考慮其他信息。例如,始終存在的投資風險。我們已經確定了Olam Group的3個警示信號(至少有2個是不可忽視的),理解它們應該是您投資過程的一部分。
Of course Olam Group may not be the best stock to buy. So you may wish to see this free collection of growth stocks.
當然,Olam Group可能不是最佳購買股票,你可能需要查看這份免費的成長股收藏。
Please note, the market returns quoted in this article reflect the market weighted average returns of stocks that currently trade on Singaporean exchanges.
請注意,本文中引用的市場回報反映了當前在新加坡交易所上市股票的市場加權平均回報。
Have feedback on this article? Concerned about the content? Get in touch with us directly. Alternatively, email editorial-team (at) simplywallst.com.
This article by Simply Wall St is general in nature. We provide commentary based on historical data and analyst forecasts only using an unbiased methodology and our articles are not intended to be financial advice. It does not constitute a recommendation to buy or sell any stock, and does not take account of your objectives, or your financial situation. We aim to bring you long-term focused analysis driven by fundamental data. Note that our analysis may not factor in the latest price-sensitive company announcements or qualitative material. Simply Wall St has no position in any stocks mentioned.
對本文有任何反饋?對內容有任何疑慮?請直接與我們聯繫。或者,發送電子郵件至editorial-team@simplywallst.com。
這篇文章是Simply Wall St的一般性文章。我們根據歷史數據和分析師預測提供評論,只使用公正的方法論,我們的文章並不意味着提供任何金融建議。文章不構成買賣任何股票的建議,也不考慮您的目標或您的財務狀況。我們的目標是帶給您基本數據驅動的長期關注分析。請注意,我們的分析可能不考慮最新的價格敏感公司公告或定性材料。Simply Wall St沒有任何股票頭寸。
譯文內容由第三人軟體翻譯。
