
NVE (NASDAQ:NVEC) Is Achieving High Returns On Its Capital
NVE (NASDAQ:NVEC) Is Achieving High Returns On Its Capital
 0.27 = US$18m ÷ (US$67m - US$1.7m)
 What trends should we look for it we want to identify stocks that can multiply in value over the long term? Firstly, we'd want to identify a growing return on capital employed (ROCE) and then alongside that, an ever-increasing base of capital employed. Put simply, these types of businesses are compounding machines, meaning they are continually reinvesting their earnings at ever-higher rates of return. Speaking of which, we noticed some great changes in NVE's (NASDAQ:NVEC) returns on capital, so let's have a look.
如果我們想識別長期內股票市值可翻番的股票,我們應該關注哪些趨勢?首先,我們需要確認資本僱用回報(ROCE)在不斷增長,其次,需要一個不斷增長的資本僱用基礎。簡而言之,這些類型的業務是複利機器,意味着它們不斷以越來越高的回報率再投資其收益。說到這裏,我們注意到NVE(納斯達克股票代碼:NVEC)的資本回報有了很大的變化,讓我們來看看。
Return On Capital Employed (ROCE): What Is It?
資本僱用回報率(ROCE)是什麼?
For those that aren't sure what ROCE is, it measures the amount of pre-tax profits a company can generate from the capital employed in its business. The formula for this calculation on NVE is:
對於那些不了解ROCE的人來說,它衡量公司可以從其業務中使用的資本生成的稅前利潤量。在NVE這個計算公式上是這樣計算的:
Return on Capital Employed = Earnings Before Interest and Tax (EBIT) ÷ (Total Assets - Current Liabilities)
資產僱用回報率(ROCE)是指企業利潤,即企業稅前利潤除以企業投入的總資本(負債加股權)。如果ROCE高於企業財務成本的承受能力,那麼企業就會創造出更多的價值。
0.27 = US$18m ÷ (US$67m - US$1.7m) (Based on the trailing twelve months to June 2024).
0.27 = 美元1800萬 ÷ (美元6700萬 - 美元1.7m)(基於截至2024年6月的上一個十二個月的數據)。
Therefore, NVE has an ROCE of 27%. In absolute terms that's a great return and it's even better than the Semiconductor industry average of 9.1%.
因此,NVE的ROCE爲27%。就絕對值來說,這是一個很好的回報率,比半導體行業平均ROCE的9.1%甚至要好。
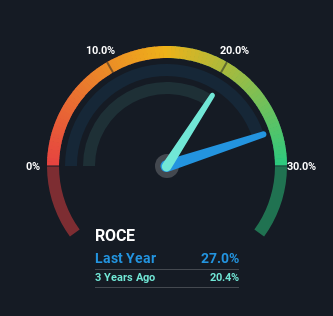
Historical performance is a great place to start when researching a stock so above you can see the gauge for NVE's ROCE against it's prior returns. If you'd like to look at how NVE has performed in the past in other metrics, you can view this free graph of NVE's past earnings, revenue and cash flow.
歷史績效是研究股票的好起點,因此您可以在上面看到NVE的ROCE與其先前回報的比較。如果您想查看NVE在過去的其他指標中的表現,可以查看此NVE過去的收益、營業收入和現金流的免費圖表。
How Are Returns Trending?
綜合上述,Cimpress非常有效地提高了其資本利用率所產生的回報。考慮到股票過去五年保持穩定,如果其他指標也不錯,則可能存在機會。因此,進一步研究這家公司並確定這些趨勢是否會持續是合理的。
NVE has not disappointed in regards to ROCE growth. We found that the returns on capital employed over the last five years have risen by 44%. The company is now earning US$0.3 per dollar of capital employed. In regards to capital employed, NVE appears to been achieving more with less, since the business is using 21% less capital to run its operation. A business that's shrinking its asset base like this isn't usually typical of a soon to be multi-bagger company.
在資本僱用回報增長方面,NVE沒有讓人們失望。我們發現,在過去的五年中,資本僱用回報率已經增長了44%。該公司目前每美元資本僱用可賺取0.3美元。就資本僱用而言,NVE似乎可以用更少的資本實現更多的收益,因爲該公司使用的資本減少了21%來運營其操作。這個縮小其資產基礎的業務通常不是即將成爲多倍股公司的典型情況。
The Bottom Line On NVE's ROCE
關於NVE的ROCE總結
In the end, NVE has proven it's capital allocation skills are good with those higher returns from less amount of capital. Since the stock has returned a solid 57% to shareholders over the last five years, it's fair to say investors are beginning to recognize these changes. In light of that, we think it's worth looking further into this stock because if NVE can keep these trends up, it could have a bright future ahead.
最終,NVE已經證明其資本配置技能很好,並且從較少的資本獲得更高的回報。自近五年來,股票已經爲股東帶來了57%的穩定回報,可以說投資者已經開始認識到這些變化。考慮到這一點,我們認爲值得更進一步地研究該股票,因爲如果NVE可以保持這些趨勢,它的未來將會光明。
One more thing to note, we've identified 1 warning sign with NVE and understanding it should be part of your investment process.
另外需要注意的是,我們已經發現了1個有關NVE的警示信號,並且了解它應該成爲您的投資過程的一部分。
NVE is not the only stock earning high returns. If you'd like to see more, check out our free list of companies earning high returns on equity with solid fundamentals.
NVE並不是唯一一家獲得高回報的股票。如果您想查看更多,請查看我們的免費公司權益高回報、基本面良好的股票列表。
Have feedback on this article? Concerned about the content? Get in touch with us directly. Alternatively, email editorial-team (at) simplywallst.com.
This article by Simply Wall St is general in nature. We provide commentary based on historical data and analyst forecasts only using an unbiased methodology and our articles are not intended to be financial advice. It does not constitute a recommendation to buy or sell any stock, and does not take account of your objectives, or your financial situation. We aim to bring you long-term focused analysis driven by fundamental data. Note that our analysis may not factor in the latest price-sensitive company announcements or qualitative material. Simply Wall St has no position in any stocks mentioned.
對本文有任何反饋?對內容有任何疑慮?請直接與我們聯繫。或者,發送電子郵件至editorial-team@simplywallst.com。
這篇文章是Simply Wall St的一般性文章。我們根據歷史數據和分析師預測提供評論,只使用公正的方法論,我們的文章並不意味着提供任何金融建議。文章不構成買賣任何股票的建議,也不考慮您的目標或您的財務狀況。我們的目標是帶給您基本數據驅動的長期關注分析。請注意,我們的分析可能不考慮最新的價格敏感公司公告或定性材料。Simply Wall St沒有任何股票頭寸。
譯文內容由第三人軟體翻譯。
