
Varex Imaging (NASDAQ:VREX Investor Three-year Losses Grow to 55% as the Stock Sheds US$67m This Past Week
Varex Imaging (NASDAQ:VREX Investor Three-year Losses Grow to 55% as the Stock Sheds US$67m This Past Week
 Varex Imaging became profitable within the last five years. We would usually expect to see the share price rise as a result. So it's worth looking at other metrics to try to understand the share price move.
 The truth is that if you invest for long enough, you're going to end up with some losing stocks. But the last three years have been particularly tough on longer term Varex Imaging Corporation (NASDAQ:VREX) shareholders. Sadly for them, the share price is down 55% in that time. And the ride hasn't got any smoother in recent times over the last year, with the price 43% lower in that time. The falls have accelerated recently, with the share price down 18% in the last three months. We note that the company has reported results fairly recently; and the market is hardly delighted. You can check out the latest numbers in our company report.
事實是,如果您投資足夠長的時間,您最終會持有一些賠錢的股票。但在過去的三年中,持有美國納斯達克上市公司Varex Imaging Corporation(NASDAQ:VREX)的股票的長期股東遭受了巨大的打擊。遺憾的是,股價在這段時間內下跌了55%。即使在最近的一年中,股價也下跌了43%。近期下跌的趨勢持續加劇,在過去的三個月中,股價下跌了18%。我們注意到,公司最近公佈了業績報告;而市場也並不十分滿意。您可以在我們的公司報告中查看最新的數字。
Given the past week has been tough on shareholders, let's investigate the fundamentals and see what we can learn.
考慮到過去一週對股東來說是艱難的,讓我們調查一下基本面並看看我們能學到什麼。
While the efficient markets hypothesis continues to be taught by some, it has been proven that markets are over-reactive dynamic systems, and investors are not always rational. By comparing earnings per share (EPS) and share price changes over time, we can get a feel for how investor attitudes to a company have morphed over time.
儘管一些人繼續教授有效市場假說,但已經證明市場是過度反應的動態系統,並且投資者並不總是理性的。通過比較每股收益(EPS)和股價的變化情況,我們可以了解投資者對公司的態度如何隨着時間變化而變化。
Varex Imaging became profitable within the last five years. We would usually expect to see the share price rise as a result. So it's worth looking at other metrics to try to understand the share price move.
Varex Imaging在過去五年內實現了盈利。通常情況下,我們會期望股價上漲。因此,值得查看其他指標,以嘗試了解股票價格的變化。
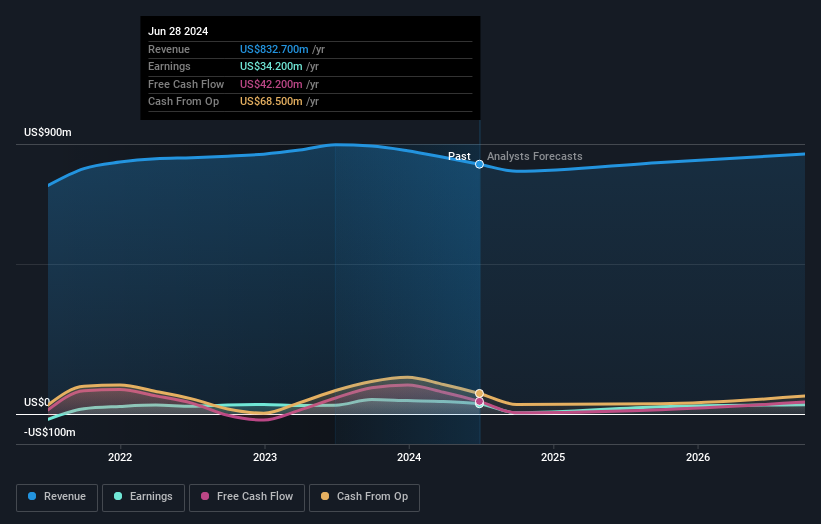
The company has kept revenue pretty healthy over the last three years, so we doubt that explains the falling share price. There doesn't seem to be any clear correlation between the fundamental business metrics and the share price. That could mean that the stock was previously overrated, or it could spell opportunity now.
公司在過去三年中的營業收入一直非常健康,因此我們懷疑這解釋了股價下跌的原因。基本業務指標與股價之間似乎沒有明顯的相關性。這可能意味着該股票曾被高估,或者現在可能是機會。
You can see how earnings and revenue have changed over time in the image below (click on the chart to see the exact values).
你可以在下面的圖片中看到收入和營業收入隨時間的變化情況(單擊圖表可查看精確值)。
We know that Varex Imaging has improved its bottom line over the last three years, but what does the future have in store? This free interactive report on Varex Imaging's balance sheet strength is a great place to start, if you want to investigate the stock further.
我們知道Varex Imaging在過去三年中改善了其業績,但未來會怎樣?如果您想進一步調查該股票,那麼Varex Imaging的資產負債表狀況的免費交互式報告是一個不錯的起點。
A Different Perspective
不同的觀點
Investors in Varex Imaging had a tough year, with a total loss of 43%, against a market gain of about 18%. Even the share prices of good stocks drop sometimes, but we want to see improvements in the fundamental metrics of a business, before getting too interested. Unfortunately, last year's performance may indicate unresolved challenges, given that it was worse than the annualised loss of 8% over the last half decade. Generally speaking long term share price weakness can be a bad sign, though contrarian investors might want to research the stock in hope of a turnaround. It's always interesting to track share price performance over the longer term. But to understand Varex Imaging better, we need to consider many other factors. Like risks, for instance. Every company has them, and we've spotted 2 warning signs for Varex Imaging (of which 1 is potentially serious!) you should know about.
Varex Imaging的投資者遭遇了一年的困境,總損失達到43%,而市場獲得了約18%的收益。即使好股票的股價有時也會下跌,但在感興趣之前,我們要看到業務基本指標的改善。不幸的是,去年的表現可能表明存在未解決的挑戰,因爲該損失比過去半個十年的年化損失8%還要嚴重。總體上來說,長期的股價疲軟可能是一個不好的跡象,儘管持反面意見的投資者可能會希望研究該股票以期獲得扭轉局面的可能性。追蹤股價長期表現總是很有趣的。但是要更好地了解Varex Imaging,我們需要考慮許多其他因素。例如,風險。每家公司都有風險,我們已經發現Varex Imaging的2個警告信號(其中1個可能很嚴重!)您應該知道。
If you are like me, then you will not want to miss this free list of undervalued small caps that insiders are buying.
如果您像我一樣,就不會希望錯過這份免費的內部人士正在購買的低估小市值股票列表。
Please note, the market returns quoted in this article reflect the market weighted average returns of stocks that currently trade on American exchanges.
請注意,本文所引述的市場回報反映了目前在美國交易所上市的股票的市場加權平均回報。
Have feedback on this article? Concerned about the content? Get in touch with us directly. Alternatively, email editorial-team (at) simplywallst.com.
This article by Simply Wall St is general in nature. We provide commentary based on historical data and analyst forecasts only using an unbiased methodology and our articles are not intended to be financial advice. It does not constitute a recommendation to buy or sell any stock, and does not take account of your objectives, or your financial situation. We aim to bring you long-term focused analysis driven by fundamental data. Note that our analysis may not factor in the latest price-sensitive company announcements or qualitative material. Simply Wall St has no position in any stocks mentioned.
對本文有任何反饋?對內容有任何疑慮?請直接與我們聯繫。或者,發送電子郵件至editorial-team@simplywallst.com。
這篇文章是Simply Wall St的一般性文章。我們根據歷史數據和分析師預測提供評論,只使用公正的方法論,我們的文章並不意味着提供任何金融建議。文章不構成買賣任何股票的建議,也不考慮您的目標或您的財務狀況。我們的目標是帶給您基本數據驅動的長期關注分析。請注意,我們的分析可能不考慮最新的價格敏感公司公告或定性材料。Simply Wall St沒有任何股票頭寸。
Have feedback on this article? Concerned about the content? Get in touch with us directly. Alternatively, email editorial-team@simplywallst.com
對本文有任何反饋?對內容有任何疑慮?請直接與我們聯繫。或者,發送電子郵件至editorial-team@simplywallst.com。
譯文內容由第三人軟體翻譯。