
Enerpac Tool Group (NYSE:EPAC) Has A Rock Solid Balance Sheet
Enerpac Tool Group (NYSE:EPAC) Has A Rock Solid Balance Sheet
 We can see from the most recent balance sheet that Enerpac Tool Group had liabilities of US$122.0m falling due within a year, and liabilities of US$261.7m due beyond that. Offsetting this, it had US$132.4m in cash and US$113.5m in receivables that were due within 12 months. So its liabilities outweigh the sum of its cash and (near-term) receivables by US$137.9m.
 David Iben put it well when he said, 'Volatility is not a risk we care about. What we care about is avoiding the permanent loss of capital.' So it might be obvious that you need to consider debt, when you think about how risky any given stock is, because too much debt can sink a company. As with many other companies Enerpac Tool Group Corp. (NYSE:EPAC) makes use of debt. But the real question is whether this debt is making the company risky.
David Iben曾明確表示:“波動性不是我們關心的風險,我們關心的是避免資本的永久損失。”因此,當您考慮任何股票的風險時,需要考慮債務,因爲過多的債務可能會使一家公司陷入困境。正如許多其他公司一樣,Enerpac Tool Group Corp. (紐交所:EPAC) 利用債務。但真正的問題是,這筆債務是否使公司存在風險。
When Is Debt A Problem?
什麼時候負債才是一個問題?
Debt assists a business until the business has trouble paying it off, either with new capital or with free cash flow. Ultimately, if the company can't fulfill its legal obligations to repay debt, shareholders could walk away with nothing. However, a more common (but still painful) scenario is that it has to raise new equity capital at a low price, thus permanently diluting shareholders. Of course, debt can be an important tool in businesses, particularly capital heavy businesses. The first thing to do when considering how much debt a business uses is to look at its cash and debt together.
債務爲企業提供幫助,直到企業遇到償還困難,無論是用新的資本還是自由現金流進行償還。如果公司無法履行還債的法律義務,股東可能會一無所有。不過,更普遍(但仍然痛苦)的情況是以低價格籌集新的股權資本,從而永久性稀釋股東的利益。當然,債務可以是企業中的重要工具,特別是在資本密集的企業中。考慮企業使用多少債務時,首先要做的是看看其現金和債務。
What Is Enerpac Tool Group's Net Debt?
Enerpac Tool Group的淨債務是多少?
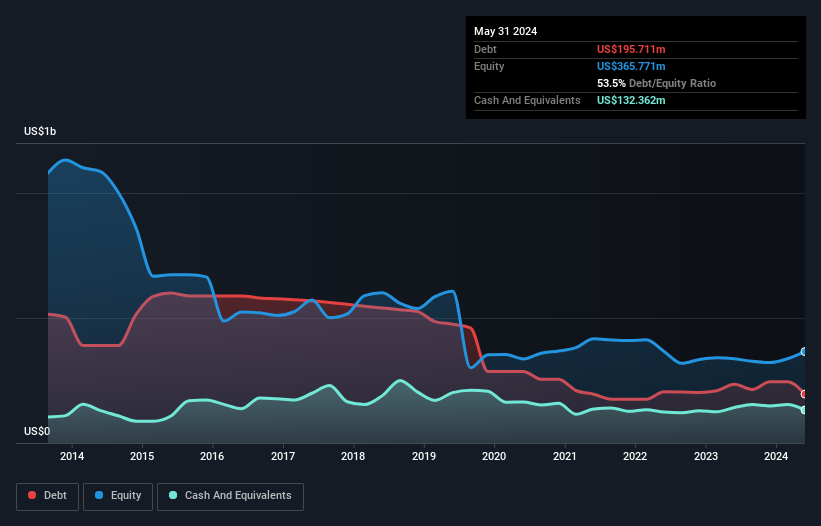
You can click the graphic below for the historical numbers, but it shows that Enerpac Tool Group had US$195.7m of debt in May 2024, down from US$234.7m, one year before. On the flip side, it has US$132.4m in cash leading to net debt of about US$63.3m.
下圖展示了Enerpac Tool Group歷史數字,您可以點擊查看,但它表明,Enerpac Tool Group在2024年5月有1.957億美元的債務,比一年前的2.347億美元減少。反過來,它有1.324億美元的現金,從而形成了淨債務約爲6330萬美元。
A Look At Enerpac Tool Group's Liabilities
關於Enerpac Tool Group的負債情況
We can see from the most recent balance sheet that Enerpac Tool Group had liabilities of US$122.0m falling due within a year, and liabilities of US$261.7m due beyond that. Offsetting this, it had US$132.4m in cash and US$113.5m in receivables that were due within 12 months. So its liabilities outweigh the sum of its cash and (near-term) receivables by US$137.9m.
我們可以從最近的資產負債表中看出,Enerpac Tool Group今年有1.22億美元的負債到期,不包括逾期負債261.7億美元。相對抵消的是,它有1.324億美元的現金和1.135億美元的應收賬款需要在12個月內到期。因此,其負債總額超過其現金和(短期)應收賬款的總和累計1.379億美元。
Given Enerpac Tool Group has a market capitalization of US$2.18b, it's hard to believe these liabilities pose much threat. However, we do think it is worth keeping an eye on its balance sheet strength, as it may change over time.
由於Enerpac Tool Group的市值爲2.18億美元,很難相信這些負債會對其構成太大的威脅。然而,我們認爲關注其資產負債表的實力是值得的,因爲它可能隨着時間的推移而發生變化。
In order to size up a company's debt relative to its earnings, we calculate its net debt divided by its earnings before interest, tax, depreciation, and amortization (EBITDA) and its earnings before interest and tax (EBIT) divided by its interest expense (its interest cover). This way, we consider both the absolute quantum of the debt, as well as the interest rates paid on it.
爲了比較一個公司的債務與其收益的關係,我們計算其淨債務除以利息、稅、折舊和攤銷前的收益和利息前的收益(其利息覆蓋率)。因此,我們考慮了債務的絕對數量以及支付的利率。
Enerpac Tool Group has a low net debt to EBITDA ratio of only 0.42. And its EBIT easily covers its interest expense, being 10.4 times the size. So you could argue it is no more threatened by its debt than an elephant is by a mouse. Also positive, Enerpac Tool Group grew its EBIT by 28% in the last year, and that should make it easier to pay down debt, going forward. The balance sheet is clearly the area to focus on when you are analysing debt. But ultimately the future profitability of the business will decide if Enerpac Tool Group can strengthen its balance sheet over time. So if you're focused on the future you can check out this free report showing analyst profit forecasts.
Enerpac Tool Group的淨債務與EBITDA比率僅爲0.42,而且它的EBIT輕鬆覆蓋了其利息支出,規模爲10.4倍。因此,您可以認爲它受到的債務威脅不比大象受到老鼠的威脅更大。此外,Enerpac Tool Group在過去一年中EBIT增長了28%,這應該使其更容易償還債務。分析債務時,資產負債表顯然是需要關注的領域。但是,最終業務的未來盈利能力將決定Enerpac Tool Group能否逐漸加強其資產負債表。因此,如果您關注未來,可以查看該免費報告,其中顯示分析師的利潤預測。
But our final consideration is also important, because a company cannot pay debt with paper profits; it needs cold hard cash. So the logical step is to look at the proportion of that EBIT that is matched by actual free cash flow. During the last three years, Enerpac Tool Group produced sturdy free cash flow equating to 59% of its EBIT, about what we'd expect. This cold hard cash means it can reduce its debt when it wants to.
但是,我們考慮的最後一個因素也很重要,因爲一家公司無法用紙面利潤償還債務;它需要冷硬現金。因此,邏輯的下一步是查看該EBIT的比例是否與實際的自由現金流相匹配。在過去的三年中,Enerpac Tool Group產生了強大的自由現金流,相當於其EBIT的59%左右,這是我們所期望的。這筆冷硬現金意味着它可以在需要時減少其債務。
Our View
我們的觀點
Happily, Enerpac Tool Group's impressive EBIT growth rate implies it has the upper hand on its debt. And that's just the beginning of the good news since its net debt to EBITDA is also very heartening. Zooming out, Enerpac Tool Group seems to use debt quite reasonably; and that gets the nod from us. While debt does bring risk, when used wisely it can also bring a higher return on equity. Over time, share prices tend to follow earnings per share, so if you're interested in Enerpac Tool Group, you may well want to click here to check an interactive graph of its earnings per share history.
令人高興的是,Enerpac Tool Group的驚人EBIT增長率意味着它在債務方面具有優勢。這僅僅是好消息的開始,因爲它的淨債務與EBITDA也非常令人欣慰。從更宏觀的角度來看,Enerpac Tool Group似乎相當合理地使用債務;這讓我們認可它。儘管債務確實帶來風險,但明智地使用時,它還可以帶來更高的股本回報率。隨着時間的推移,股價往往會跟隨每股收益,因此,如果您對Enerpac Tool Group感興趣,可以點擊此處,查看其每股收益歷史的互動圖表。
When all is said and done, sometimes its easier to focus on companies that don't even need debt. Readers can access a list of growth stocks with zero net debt 100% free, right now.
說到底,有時候更容易集中精力關注根本不需要債務的公司。讀者可以免費訪問零淨債務增長股票列表。
Have feedback on this article? Concerned about the content? Get in touch with us directly. Alternatively, email editorial-team (at) simplywallst.com.
This article by Simply Wall St is general in nature. We provide commentary based on historical data and analyst forecasts only using an unbiased methodology and our articles are not intended to be financial advice. It does not constitute a recommendation to buy or sell any stock, and does not take account of your objectives, or your financial situation. We aim to bring you long-term focused analysis driven by fundamental data. Note that our analysis may not factor in the latest price-sensitive company announcements or qualitative material. Simply Wall St has no position in any stocks mentioned.
對本文有任何反饋?對內容有任何疑慮?請直接與我們聯繫。或者,發送電子郵件至editorial-team@simplywallst.com。
這篇文章是Simply Wall St的一般性文章。我們根據歷史數據和分析師預測提供評論,只使用公正的方法論,我們的文章並不意味着提供任何金融建議。文章不構成買賣任何股票的建議,也不考慮您的目標或您的財務狀況。我們的目標是帶給您基本數據驅動的長期關注分析。請注意,我們的分析可能不考慮最新的價格敏感公司公告或定性材料。Simply Wall St沒有任何股票頭寸。
Have feedback on this article? Concerned about the content? Get in touch with us directly. Alternatively, email editorial-team@simplywallst.com
對本文有任何反饋?對內容有任何疑慮?請直接與我們聯繫。或者,發送電子郵件至editorial-team@simplywallst.com。
譯文內容由第三人軟體翻譯。