
Market Analysis: Workday And Competitors In Software Industry
Market Analysis: Workday And Competitors In Software Industry
In today's fast-paced and highly competitive business world, it is crucial for investors and industry followers to conduct comprehensive company evaluations. In this article, we will delve into an extensive industry comparison, evaluating Workday (NASDAQ:WDAY) in relation to its major competitors in the Software industry. By closely examining key financial metrics, market standing, and growth prospects, our objective is to provide valuable insights and highlight company's performance in the industry.
在今天快節奏和高度競爭的業務世界中,投資者和行業追隨者進行全面公司評估至關重要。在本文中,我們將深入探討行業比較,並評估Workday(納斯達克:WDAY)與軟件行業中的主要競爭對手的關係。通過密切檢查關鍵財務指標、市場地位和增長前景,我們的目標是提供有價值的見解,並強調公司在行業中的表現。
Workday Background
Workday背景
Workday is a software company that offers human capital management, or HCM, financial management, and business planning solutions. Known for being a cloud-only software provider, Workday is headquartered in Pleasanton, California. Founded in 2005, Workday now employs over 18,000 employees.
Workday是一家提供人力資本管理、財務管理和業務規劃解決方案的軟件公司。Workday以雲計算軟件提供商而聞名,總部位於加利福尼亞州普萊森頓。該公司成立於2005年,現有員工超過18,000人。
| Company | P/E | P/B | P/S | ROE | EBITDA (in billions) | Gross Profit (in billions) | Revenue Growth |
|---|---|---|---|---|---|---|---|
| Workday Inc | 40.75 | 7.43 | 8.08 | 1.32% | $0.23 | $1.5 | 18.17% |
| Salesforce Inc | 47.25 | 4.27 | 7.23 | 2.57% | $2.6 | $6.97 | 10.74% |
| SAP SE | 91.17 | 5.52 | 7.11 | 2.1% | $1.94 | $6.02 | 9.72% |
| Adobe Inc | 48.83 | 16.21 | 12.12 | 10.38% | $2.19 | $4.71 | 10.24% |
| Intuit Inc | 58.54 | 9.44 | 11.37 | 13.4% | $3.34 | $5.67 | 11.95% |
| Synopsys Inc | 59.60 | 11.71 | 13.46 | 4.23% | $0.41 | $1.15 | 15.2% |
| Cadence Design Systems Inc | 67.02 | 16.62 | 16.97 | 5.86% | $0.38 | $0.92 | 8.61% |
| Palantir Technologies Inc | 226.50 | 16.03 | 27.29 | 2.91% | $0.09 | $0.52 | 20.78% |
| Roper Technologies Inc | 41.02 | 3.24 | 8.99 | 1.88% | $0.69 | $1.19 | 2.15% |
| Autodesk Inc | 52.36 | 24.02 | 9.23 | 12.55% | $0.34 | $1.28 | 11.66% |
| Datadog Inc | 347.94 | 17.97 | 18.83 | 2.02% | $0.06 | $0.5 | 26.89% |
| Ansys Inc | 62.70 | 5.04 | 12.26 | 0.64% | $0.09 | $0.4 | -8.41% |
| AppLovin Corp | 46.70 | 33.55 | 7.62 | 23.28% | $0.45 | $0.76 | 47.9% |
| Tyler Technologies Inc | 122.29 | 8.01 | 12.53 | 2.2% | $0.11 | $0.24 | 5.59% |
| PTC Inc | 72.72 | 7.07 | 9.31 | 3.98% | $0.21 | $0.49 | 11.23% |
| Zoom Video Communications Inc | 22.17 | 2.24 | 4.10 | 2.65% | $0.23 | $0.87 | 3.25% |
| Manhattan Associates Inc | 78.80 | 65.78 | 16.20 | 21.98% | $0.07 | $0.15 | 4.23% |
| Bentley Systems Inc | 44.93 | 15.62 | 12.91 | 7.74% | $0.12 | $0.28 | 7.43% |
| Dynatrace Inc | 85.19 | 6.55 | 9.27 | 1.93% | $0.04 | $0.31 | 21.11% |
| Average | 87.54 | 14.94 | 12.04 | 6.79% | $0.74 | $1.8 | 12.24% |
| 公司 | 市銷率P/S | 淨資產收益率ROE | 息稅前收入EBITDA (以十億計) | 毛利潤 (以十億計) | 營收增長 | CrowdStrike Holdings Inc (847.84) | 營業收入增長 |
|---|---|---|---|---|---|---|---|
| Workday公司 | 40.75 | 7.43 | 8.08 | 1.32% | $0.23 | $1.5 | 18.17% |
| Salesforce 公司 | 47.25 | 4.27 | 7.23 | 2.57% | $2.6 | $6.97 | 10.74% |
| sap se | 91.17 | 5.52 | 7.11 | 2.1% | $1.94每股 | $6.02 | 9.72% |
| adobe 公司 | 48.83 | 16.21 | 12.12 | 10.38% | $2.19 | $4.71 | 10.24% |
| Intuit 公司 | 58.54 | 9.44 | 11.37 | 13.4% | 3.34美元 | $5.67 | 11.95% |
| Synopsys 公司 | 59.60 | 11.71 | 13.46 | 4.23% | $0.41 | $1.15 | 15.2% |
| 鏗騰電子股份有限公司 | 67.02 | 16.62 | 16.97 | 5.86% | $0.38 | 0.92美元 | 8.61% |
| palantir科技公司 | 226.50 | 16.03 | 27.29 | 2.91% | $0.09 | 0.52美元 | 20.78% |
| 儒博實業股份有限公司 | 41.02 | 3.24 | 8.99 | 1.88% | $0.69 | $1.19 | 2.15% |
| 歐特克公司 | 52.36 | 24.02 | 9.23 | 12.55% | $0.34 | $1.28 | 11.66% |
| datadog | 347.94 | 17.97 | 18.83 | 2.02% | 0.06美元 | $0.5 | 26.89% |
| 安澤斯公司 | 62.70 | 5.04 | 12.26 | 0.64% | $0.09 | $0.4 | -8.41% |
| AppLovin公司 | 46.70 | 33.55 | 7.62 | 23.28% | $0.45 | $0.76 | 47.9% |
| Tyler Technologies公司 | 122.29 | 8.01 | 12.53 | 2.2% | $0.11 | 0.24美元 | 5.59% |
| PTC公司 | 72.72 | 7.07 | 9.31 | 3.98% | 0.21美元 | $0.49 | 11.23% |
| zoom視頻通訊公司 | 22.17 | 2.24 | 4.10 | 2.65% | $0.23 | $0.87 | 3.25% |
| Manhattan Associates公司 | 78.80 | 65.78 | 16.20 | 21.98% | 0.07美元 | 0.15美元 | 4.23% |
| Bentley Systems公司 | 44.93 | 15.62 | 12.91 | 7.74% | $0.12 | $0.28 | 7.43% |
| dynatrace公司 | 85.19 | 6.55 | 9.27 | 1.93% | 0.04美元 | $0.31 | 21.11% |
| 平均值 | 87.54 | 14.94 | 12.04 | 6.79% | 每加元0.74 | $1.8 | 12.24% |
By closely studying Workday, we can observe the following trends:
通過密切研究Workday,我們可以觀察到以下趨勢:
A Price to Earnings ratio of 40.75 significantly below the industry average by 0.47x suggests undervaluation. This can make the stock appealing for those seeking growth.
With a Price to Book ratio of 7.43, significantly falling below the industry average by 0.5x, it suggests undervaluation and the possibility of untapped growth prospects.
With a relatively low Price to Sales ratio of 8.08, which is 0.67x the industry average, the stock might be considered undervalued based on sales performance.
The company has a lower Return on Equity (ROE) of 1.32%, which is 5.47% below the industry average. This indicates potential inefficiency in utilizing equity to generate profits, which could be attributed to various factors.
The Earnings Before Interest, Taxes, Depreciation, and Amortization (EBITDA) of $230 Million is 0.31x below the industry average, suggesting potential lower profitability or financial challenges.
The gross profit of $1.5 Billion is 0.83x below that of its industry, suggesting potential lower revenue after accounting for production costs.
The company is experiencing remarkable revenue growth, with a rate of 18.17%, outperforming the industry average of 12.24%.
市盈率爲40.75,相比行業平均水平低0.47倍,表明被低估。這可能會使該股票對那些尋求成長的人具有吸引力。
市淨率爲7.43,比行業平均水平低0.5倍,表明其被低估,並存在未開發的增長前景。
市銷率相對較低,爲8.08,僅爲行業平均水平的0.67倍,這表明股票根據銷售表現可能被低估。
公司的淨資產收益率(ROE)爲1.32%,低於行業平均水平5.47%,這表明在利用資產獲利方面存在潛在的低效率問題,可能的原因有很多。
公司的息稅前利潤、折舊及攤銷前利潤和攤銷前利潤(EBITDA)爲2.3億美元,低於行業平均水平的0.31倍,這表明公司可能面臨較低的盈利能力或財務挑戰。
公司的毛利潤爲15億美元,比同行業低0.83倍,表明考慮了生產成本之後,公司的潛在營收較低。
公司經歷了顯着的營收增長,增長率爲18.17%,優於行業平均水平的12.24%。
Debt To Equity Ratio
債務權益比率
The debt-to-equity (D/E) ratio is an important measure to assess the financial structure and risk profile of a company.
債務與股權(D/E)比是評估公司財務結構和風險承擔能力的重要指標。
Considering the debt-to-equity ratio in industry comparisons allows for a concise evaluation of a company's financial health and risk profile, aiding in informed decision-making.
在行業比較中考慮債務權益比率可以簡明地評估公司的財務狀況和風險特徵,有助於投資者做出明智的決策。
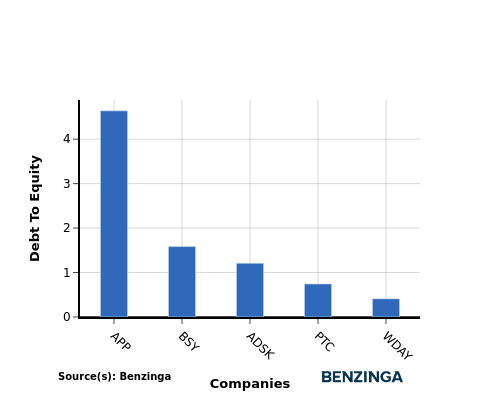
In terms of the Debt-to-Equity ratio, Workday stands in comparison with its top 4 peers, leading to the following comparisons:
在負債權益比方面,Workday與其排名前四位的同行進行比較,結果如下所示:
When considering the debt-to-equity ratio, Workday exhibits a stronger financial position compared to its top 4 peers.
This indicates that the company has a favorable balance between debt and equity, with a lower debt-to-equity ratio of 0.41, which can be perceived as a positive aspect by investors.
考慮負債權益比時,Workday與其前四大同行相比,其財務狀況更強。
這表明公司在債務和股本之間有一個有利的平衡,負債權益比較低,這是投資者可以看作是一個積極因素。
Key Takeaways
要點
For Workday in the Software industry, the PE, PB, and PS ratios are all low compared to peers, indicating potential undervaluation. However, the low ROE, EBITDA, and gross profit suggest lower profitability levels. On the positive side, the high revenue growth rate stands out among industry peers, indicating strong potential for future growth and market share expansion.
對於軟件行業的Workday,市盈率、市淨率和市銷率均較低,與同行相比,表明其有潛在的低估價值,然而低的ROE、EBITDA和毛利潤則表明其盈利水平較低。積極的一面是,高營收增長率在業內同行中脫穎而出,表明公司未來具有強大的增長潛力和市場份額擴張空間。
This article was generated by Benzinga's automated content engine and reviewed by an editor.
本文由Benzinga的自動化內容引擎生成並由編輯審查。
譯文內容由第三人軟體翻譯。