
Target's (NYSE:TGT) Earnings Growth Rate Lags the 15% CAGR Delivered to Shareholders
Target's (NYSE:TGT) Earnings Growth Rate Lags the 15% CAGR Delivered to Shareholders
While Target Corporation (NYSE:TGT) shareholders are probably generally happy, the stock hasn't had particularly good run recently, with the share price falling 11% in the last quarter. But at least the stock is up over the last five years. In that time, it is up 77%, which isn't bad, but is below the market return of 95%. While the returns over the last 5 years have been good, we do feel sorry for those shareholders who haven't held shares that long, because the share price is down 44% in the last three years.
雖然Target Corporation(NYSE:TGT)的股東們可能普遍感到高興,但股票最近的表現並不算好,上個季度股價下跌了11%。但最起碼股票在過去五年裏上漲了77%,這還不錯,但低於市場回報率95%。儘管過去5年的回報率不錯,但我們確實爲那些沒有持有股票的股東感到難過,因爲過去3年股價下跌了44%。
While this past week has detracted from the company's five-year return, let's look at the recent trends of the underlying business and see if the gains have been in alignment.
雖然過去的一週削弱了公司的五年回報,但讓我們看看業務的最近趨勢,並查看收益是否已對齊。
There is no denying that markets are sometimes efficient, but prices do not always reflect underlying business performance. One flawed but reasonable way to assess how sentiment around a company has changed is to compare the earnings per share (EPS) with the share price.
市場有時毫無疑問是有效的,但股票價格並不總是反映基本業務表現。一種有缺陷但合理的方法是比較每股收益(EPS)和股票價格,以評估圍繞公司的情緒如何變化。
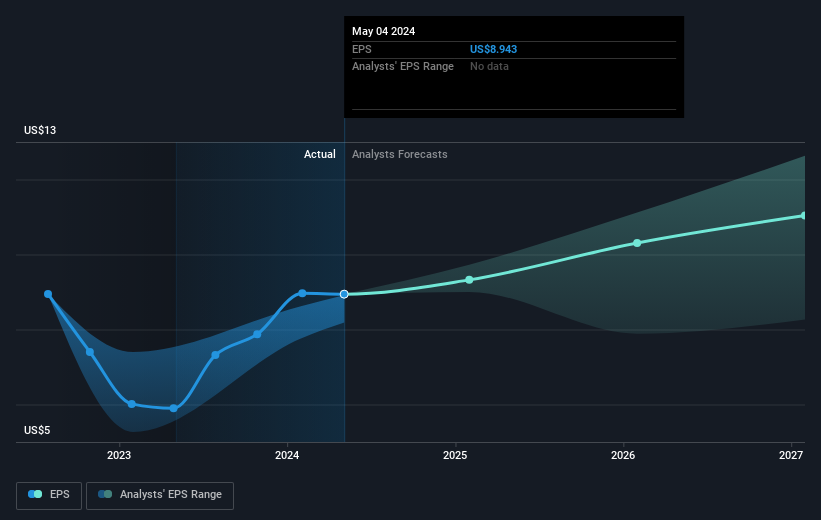
During five years of share price growth, Target achieved compound earnings per share (EPS) growth of 9.2% per year. This EPS growth is lower than the 12% average annual increase in the share price. This suggests that market participants hold the company in higher regard, these days. That's not necessarily surprising considering the five-year track record of earnings growth.
在股價增長的五年中,Target實現了每股收益(EPS)複合增長率達9.2%。雖然這個EPS增長率低於股價平均年增長率12%,但這表明市場參與者近期對該公司的評價比較高。考慮到過去五年的盈利增長記錄,這並不奇怪。
You can see how EPS has changed over time in the image below (click on the chart to see the exact values).
您可以在下面的圖片中查看每股收益如何隨時間變化(單擊圖表以查看確切的價值)。
We know that Target has improved its bottom line lately, but is it going to grow revenue? Check if analysts think Target will grow revenue in the future.
我們知道Target最近已經改善了底線,但它是否會增加營業收入呢?請查看分析師是否認爲Target將來會增加營業收入。
What About Dividends?
那麼分紅怎麼樣呢?
It is important to consider the total shareholder return, as well as the share price return, for any given stock. The TSR incorporates the value of any spin-offs or discounted capital raisings, along with any dividends, based on the assumption that the dividends are reinvested. Arguably, the TSR gives a more comprehensive picture of the return generated by a stock. We note that for Target the TSR over the last 5 years was 98%, which is better than the share price return mentioned above. This is largely a result of its dividend payments!
對於任何給定的股票來說,考慮總股東回報以及股價回報都是很重要的。TSR包括任何紅利再投資的股票分拆或折價融資的價值,外加上任何股息。可以說,TSR給出了股票產生的更全面的回報圖像。我們注意到,對於Target來說,過去5年的TSR爲98%,高於上面提到的股價回報。這在很大程度上是其分紅派息的結果!
A Different Perspective
不同的觀點
Target shareholders are up 12% for the year (even including dividends). Unfortunately this falls short of the market return. If we look back over five years, the returns are even better, coming in at 15% per year for five years. It may well be that this is a business worth popping on the watching, given the continuing positive reception, over time, from the market. I find it very interesting to look at share price over the long term as a proxy for business performance. But to truly gain insight, we need to consider other information, too. For example, we've discovered 2 warning signs for Target that you should be aware of before investing here.
包括股息在內,Target的股東今年增長了12%,但市場回報率卻不足。如果我們回顧過去的五年,回報率更好,爲每年15%。隨着市場持續的積極反應,這可能是一個值得關注的業務。我發現通過長期股票價格作爲業務績效的代理很有意思。但爲了真正獲得洞見,我們還需要考慮其他信息。例如,我們已經發現了2個Target的警告信號,您在此投資之前應該意識到。
If you like to buy stocks alongside management, then you might just love this free list of companies. (Hint: many of them are unnoticed AND have attractive valuation).
如果您喜歡與管理層一起購買股票,那麼您可能會喜歡這個公司的免費列表。 (提示:其中許多公司不爲人注意且具有吸引力的估值。)
Please note, the market returns quoted in this article reflect the market weighted average returns of stocks that currently trade on American exchanges.
請注意,本文所引述的市場回報反映了目前在美國交易所上市的股票的市場加權平均回報。
Have feedback on this article? Concerned about the content? Get in touch with us directly. Alternatively, email editorial-team (at) simplywallst.com.
This article by Simply Wall St is general in nature. We provide commentary based on historical data and analyst forecasts only using an unbiased methodology and our articles are not intended to be financial advice. It does not constitute a recommendation to buy or sell any stock, and does not take account of your objectives, or your financial situation. We aim to bring you long-term focused analysis driven by fundamental data. Note that our analysis may not factor in the latest price-sensitive company announcements or qualitative material. Simply Wall St has no position in any stocks mentioned.
對本文有任何反饋?對內容有任何疑慮?請直接與我們聯繫。或者,發送電子郵件至editorial-team@simplywallst.com。
這篇文章是Simply Wall St的一般性文章。我們根據歷史數據和分析師預測提供評論,只使用公正的方法論,我們的文章並不意味着提供任何金融建議。文章不構成買賣任何股票的建議,也不考慮您的目標或您的財務狀況。我們的目標是帶給您基本數據驅動的長期關注分析。請注意,我們的分析可能不考慮最新的價格敏感公司公告或定性材料。Simply Wall St沒有任何股票頭寸。
Have feedback on this article? Concerned about the content? Get in touch with us directly. Alternatively, email editorial-team@simplywallst.com
對本文有任何反饋?對內容有任何疑慮?請直接與我們聯繫。或者,發送電子郵件至editorial-team@simplywallst.com。
譯文內容由第三人軟體翻譯。