
Assessing Visa's Performance Against Competitors In Financial Services Industry
Assessing Visa's Performance Against Competitors In Financial Services Industry
In the dynamic and fiercely competitive business environment, conducting a thorough analysis of companies is crucial for investors and industry enthusiasts. In this article, we will perform an extensive industry comparison, evaluating Visa (NYSE:V) in relation to its major competitors in the Financial Services industry. By closely examining crucial financial metrics, market position, and growth prospects, we aim to offer valuable insights for investors and shed light on company's performance within the industry.
在動態而激烈的商業環境中,對公司進行深入分析對於投資者和行業愛好者至關重要。在本文中,我們將進行廣泛的行業比較,評估納斯達克交易所上市公司Visa(NYSE:V)與其在金融服務行業的主要競爭對手的關係。通過密切檢查重要的財務指標、市場地位和增長前景,我們旨在爲投資者提供寶貴的見解,並揭示公司在行業內的表現。
Visa Background
Visa背景
Visa is the largest payment processor in the world. In fiscal 2023, it processed almost $15 trillion in total volume. Visa operates in over 200 countries and processes transactions in over 160 currencies. Its systems are capable of processing over 65,000 transactions per second.
Visa是世界上最大的支付處理器。在2023財年,它的總成交量接近15萬億美元。Visa在200多個國家和地區開展業務,並可以處理來自160多種貨幣的交易。其系統每秒可處理超過65000筆交易。
| Company | P/E | P/B | P/S | ROE | EBITDA (in billions) | Gross Profit (in billions) | Revenue Growth |
|---|---|---|---|---|---|---|---|
| Visa Inc | 27.21 | 12.91 | 14.88 | 12.62% | $6.45 | $7.13 | 1.42% |
| Mastercard Inc | 34.38 | 55.50 | 15.83 | 42.49% | $3.92 | $4.83 | 10.44% |
| Fiserv Inc | 28.03 | 3.35 | 4.87 | 2.51% | $1.96 | $2.88 | 7.39% |
| PayPal Holdings Inc | 14.63 | 2.94 | 2.08 | 4.25% | $1.56 | $3.46 | 9.36% |
| Fidelity National Information Services Inc | 104.62 | 2.33 | 4.47 | 3.9% | $0.8 | $0.92 | 2.92% |
| Block Inc | 102.85 | 2.01 | 1.67 | 2.51% | $0.51 | $2.09 | 19.38% |
| Global Payments Inc | 19.56 | 1.13 | 2.62 | 1.39% | $0.95 | $1.5 | 5.57% |
| Corpay Inc | 21.28 | 6.17 | 5.59 | 7.03% | $0.48 | $0.73 | 3.76% |
| Jack Henry & Associates Inc | 32.36 | 6.88 | 5.60 | 4.97% | $0.17 | $0.21 | 5.9% |
| WEX Inc | 29.07 | 4.21 | 2.97 | 3.66% | $0.23 | $0.39 | 6.65% |
| Euronet Worldwide Inc | 17.36 | 3.71 | 1.32 | 6.76% | $0.18 | $0.41 | 15.08% |
| PagSeguro Digital Ltd | 13.49 | 1.71 | 2.58 | 3.57% | $1.77 | $0.2 | 10.15% |
| Shift4 Payments Inc | 44.20 | 6.26 | 1.50 | 3.1% | $0.1 | $0.19 | 29.32% |
| The Western Union Co | 7.33 | 10.54 | 1.03 | 32.55% | $0.24 | $0.41 | 1.18% |
| StoneCo Ltd | 14.06 | 1.52 | 1.98 | 2.52% | $0.9 | $2.14 | 15.45% |
| Paymentus Holdings Inc | 86.70 | 5.64 | 3.85 | 1.66% | $0.02 | $0.05 | 24.64% |
| Evertec Inc | 34.45 | 4.33 | 3.04 | 2.9% | $0.07 | $0.1 | 28.47% |
| DLocal Ltd | 16.91 | 4.51 | 3.23 | 3.8% | $0.05 | $0.06 | 34.34% |
| Payoneer Global Inc | 17.90 | 3.03 | 2.42 | 4.37% | $0.05 | $0.19 | 18.84% |
| Average | 35.51 | 6.99 | 3.7 | 7.44% | $0.78 | $1.15 | 13.82% |
| 公司 | 市銷率P/S | 淨資產收益率ROE | 息稅前收入EBITDA (以十億計) | 毛利潤 (以十億計) | 營收增長 | CrowdStrike Holdings Inc (847.84) | 營業收入增長 |
|---|---|---|---|---|---|---|---|
| Visa公司 | 27.21 | 12.91 | 14.88 | 12.62% | $6.45 | $7.13 | 1.42% |
| 萬事達公司 | 34.38 | 55.50 | 每股有形資產淨值 | 42.49% | $3.92 | $4.83 | 10.44% |
| Fiserv公司 | 28.03 | 3.35 | 4.87 | 2.51% | 1.96美元 | $2.88 | 7.39% |
| PayPal Holdings Inc | 14.63 | 2.94 | 2.08 | 4.25% | 1.56美元 | 3.46美元 | 9.36% |
| 繁德信息技術公司 | 104.62 | 2.33 | 4.47 | 3.9% | $0.8 | 0.92美元 | 2.92% |
| Block公司 | 102.85 | 2.01 | 1.67 | 2.51% | $0.51 | $2.09 | 19.38% |
| Global Payments公司 | 19.56 | 1.13 | 2.62 | 1.39% | 0.95美元 | $1.5 | 5.57% |
| Corpay公司 | 21.28 | 6.17 | 5.59 | 7.03% | 0.48美元 | 0.73美元 | 3.76% |
| 傑克·亨利和合夥人公司 | 32.36 | 6.88 | 5.60 | 4.97% | 0.17美元 | 0.21美元 | 5.9% |
| wex inc | 29.07 | 4.21 | 2.97 | 3.66% | $0.23 | 0.39美元 | 6.65% |
| Euronet Worldwide Inc | 17.36% | 3.71 | 1.32 | 6.76% | $0.18 | $0.41 | 15.08% |
| pagseguro digital有限公司 | 13.49 | 1.71 | 2.58 | 3.57% | $1.77 | $0.2 | 10.15% |
| shift4 payments inc | 44.20 | 6.26 | 1.50 | 3.1% | 0.1美元 | $0.19 | 29.32% |
| 西聯匯款公司 | 7.33 | 10.54 | 1.03 | 32.55% | 0.24美元 | $0.41 | 1.18% |
| stoneco ltd | 14.06 | 1.52美元 | 1.98 | 2.52% | $0.9 | $2.14 | 15.45% |
| Paymentus Holdings Inc | 86.70 | 5.64 | 3.85 | 1.66% | $0.02 | $0.05 | 24.64% |
| Evertec Inc | 34.45 | 4.33 | 3.04 | 2.9% | 0.07美元 | 0.1美元 | 28.47% |
| DLocal有限公司 | 16.91 | 4.51 | 3.23 | 3.8% | $0.05 | 0.06美元 | 34.34% |
| Payoneer全球貨幣公司 | 17.90 | 3.03 | 2.42 | 4.37% | $0.05 | $0.19 | 18.84% |
| 平均值 | 35.51 | 6.99 | 3.7 | 7.44% | $0.78 | $1.15 | 13.82% |
By thoroughly analyzing Visa, we can discern the following trends:
通過徹底分析Visa,我們可以看出以下趨勢:
At 27.21, the stock's Price to Earnings ratio is 0.77x less than the industry average, suggesting favorable growth potential.
It could be trading at a premium in relation to its book value, as indicated by its Price to Book ratio of 12.91 which exceeds the industry average by 1.85x.
The Price to Sales ratio of 14.88, which is 4.02x the industry average, suggests the stock could potentially be overvalued in relation to its sales performance compared to its peers.
With a Return on Equity (ROE) of 12.62% that is 5.18% above the industry average, it appears that the company exhibits efficient use of equity to generate profits.
Compared to its industry, the company has higher Earnings Before Interest, Taxes, Depreciation, and Amortization (EBITDA) of $6.45 Billion, which is 8.27x above the industry average, indicating stronger profitability and robust cash flow generation.
The gross profit of $7.13 Billion is 6.2x above that of its industry, highlighting stronger profitability and higher earnings from its core operations.
The company's revenue growth of 1.42% is significantly below the industry average of 13.82%. This suggests a potential struggle in generating increased sales volume.
股票的市盈率爲27.21,比行業平均水平低0.77倍,表明具有良好的增長潛力。
它的市淨率爲12.91,超過行業平均水平1.85倍,表明它可能以溢價的價格交易相對於其賬面價值而言。
14.88的市銷率比行業平均水平高出4.02倍,表明相對於同行業,在銷售業績方面,這隻股票可能被高估。
其回報率(ROE)爲12.62%,比行業平均水平高5.18%,表明該公司利用股權產生利潤的效率高。
與同行業相比,公司的息稅折舊及攤銷前利潤(EBITDA)更高,達到64.5億美元,是行業平均水平的8.27倍,表明其盈利能力較強,現金流較爲充沛。
713億美元的毛利潤比行業高出6.2倍,凸顯其盈利能力更強,核心業務收益更高。
該公司的營收增長率爲1.42%,顯著低於行業平均水平的13.82%,表明其在產生銷售增長方面存在潛在困難。
Debt To Equity Ratio
債務權益比率
The debt-to-equity (D/E) ratio provides insights into the proportion of debt a company has in relation to its equity and asset value.
負債-權益(D/E)比率揭示了公司債務與其權益和資產價值的比例。
Considering the debt-to-equity ratio in industry comparisons allows for a concise evaluation of a company's financial health and risk profile, aiding in informed decision-making.
在行業比較中考慮債務權益比率可以簡明地評估公司的財務狀況和風險特徵,有助於投資者做出明智的決策。
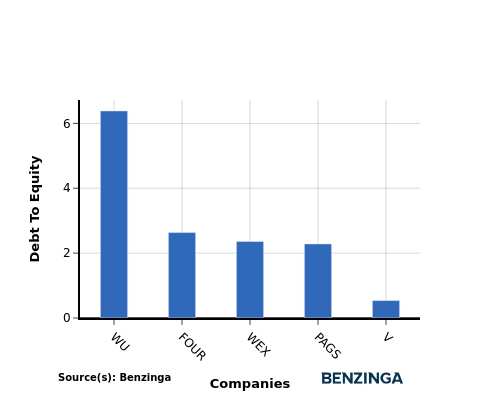
In light of the Debt-to-Equity ratio, a comparison between Visa and its top 4 peers reveals the following information:
通過比較Visa與其前4名同行的負債-所有者權益比率,我們可以得出以下信息:
Visa is in a relatively stronger financial position compared to its top 4 peers, as evidenced by its lower debt-to-equity ratio of 0.54.
This implies that the company relies less on debt financing and has a more favorable balance between debt and equity.
相對於其前4位同行而言,Visa的財務狀況較爲穩健,其負債-所有者權益比率低於0.54。
這意味着公司更少地依賴於債務融資,並且在債務和股權之間具有更優的平衡。
Key Takeaways
要點
For Visa, the PE ratio is low compared to peers, indicating potential undervaluation. The high PB and PS ratios suggest strong market sentiment and revenue multiples. In terms of ROE, EBITDA, and gross profit, Visa demonstrates high profitability and operational efficiency. However, the low revenue growth may raise concerns about future performance compared to industry peers in the Financial Services sector.
對於威士卡,市盈率較同行業低,表明潛在的低估值。高市淨率和市銷率表明市場情緒強烈,收入倍增。在roe、ebitda和毛利潤方面,威士卡表現出高盈利能力和運營效率。然而,低營業收入增長率可能會引起人們對未來表現的擔憂,與金融服務板塊的行業同行相比。
This article was generated by Benzinga's automated content engine and reviewed by an editor.
本文由Benzinga的自動化內容引擎生成並由編輯審查。
譯文內容由第三人軟體翻譯。