
Investors in Eastman Chemical (NYSE:EMN) Have Seen Decent Returns of 51% Over the Past Five Years
Investors in Eastman Chemical (NYSE:EMN) Have Seen Decent Returns of 51% Over the Past Five Years
When you buy and hold a stock for the long term, you definitely want it to provide a positive return. Furthermore, you'd generally like to see the share price rise faster than the market. Unfortunately for shareholders, while the Eastman Chemical Company (NYSE:EMN) share price is up 27% in the last five years, that's less than the market return. Over the last twelve months the stock price has risen a very respectable 10.0%.
當您長揸一支股票時,股票的回報率應該是正數。此外,您應該希望股票價格上漲的速度超過市場平均水平。不幸的是,伊士曼化工公司(紐交所:EMN)的股價在過去5年中上漲了27%,但這個增長速度低於市場平均水平。在過去12個月中,股票價格已上漲10.0%,這是非常不錯的表現。
So let's assess the underlying fundamentals over the last 5 years and see if they've moved in lock-step with shareholder returns.
因此,讓我們評估過去5年的基本面,看看它們是否和股東的回報率相符。
In his essay The Superinvestors of Graham-and-Doddsville Warren Buffett described how share prices do not always rationally reflect the value of a business. One way to examine how market sentiment has changed over time is to look at the interaction between a company's share price and its earnings per share (EPS).
在他的《格雷厄姆和道德斯維爾的超級投資者》一文中,禾倫·巴菲特描述了股價並不總是合理反映企業價值的方法。檢驗市場情緒如何隨時間變化的一種方法是觀察公司股價和每股收益(EPS)之間的互動關係。
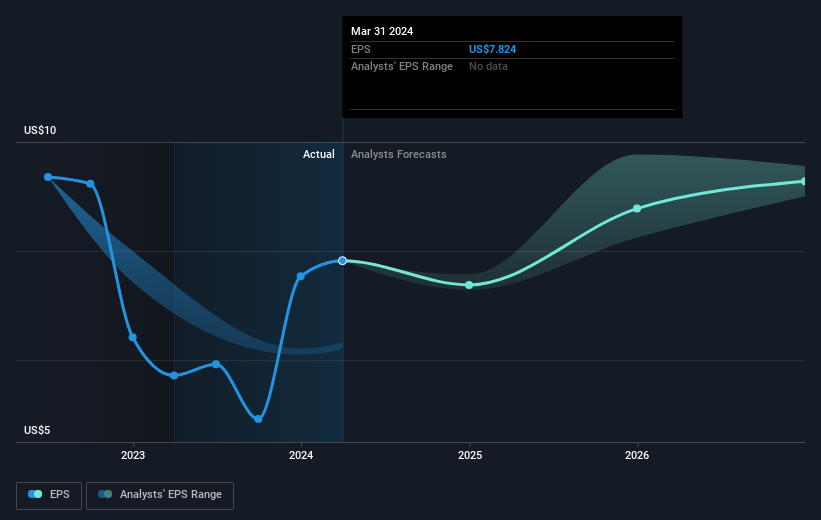
Over half a decade, Eastman Chemical managed to grow its earnings per share at 2.0% a year. This EPS growth is lower than the 5% average annual increase in the share price. This suggests that market participants hold the company in higher regard, these days. That's not necessarily surprising considering the five-year track record of earnings growth.
在過去的五年中,伊士曼化工成功地實現了每年2.0%的每股收益增長,但這個增長速度低於股價平均年增長率5%。這表明,目前市場參與者更看好伊士曼化工的前景。考慮到伊士曼化工在過去五年中的盈利增長記錄,這並不令人意外。
You can see below how EPS has changed over time (discover the exact values by clicking on the image).
下面可以看到每股收益隨時間的變化情況(通過點擊圖像來查看確切數值)。
We know that Eastman Chemical has improved its bottom line lately, but is it going to grow revenue? Check if analysts think Eastman Chemical will grow revenue in the future.
我們知道,伊士曼化工的底線得到了改善,但它會增長營業收入嗎?請檢查分析師是否認爲伊士曼化工將來會增加營業收入。
What About Dividends?
那麼分紅怎麼樣呢?
When looking at investment returns, it is important to consider the difference between total shareholder return (TSR) and share price return. Whereas the share price return only reflects the change in the share price, the TSR includes the value of dividends (assuming they were reinvested) and the benefit of any discounted capital raising or spin-off. So for companies that pay a generous dividend, the TSR is often a lot higher than the share price return. In the case of Eastman Chemical, it has a TSR of 51% for the last 5 years. That exceeds its share price return that we previously mentioned. And there's no prize for guessing that the dividend payments largely explain the divergence!
在考慮投資回報率時,重要的是要考慮總股東回報率(TSR)和股票價格回報率之間的差異。股票價格回報率只反映了股票價格的變化,而TSR則包括股息價值(假定它們被再投資)以及任何折扣的融資或分拆的利益。因此,對於支付大量股息的公司,TSR通常比股票價格回報率高得多。對於伊士曼化工而言,過去5年的TSR爲51%。這超過了我們之前提到的股票價格回報率。毫無疑問,股息支付很大程度上解釋了這種差異!
A Different Perspective
不同的觀點
Eastman Chemical provided a TSR of 14% over the last twelve months. But that return falls short of the market. The silver lining is that the gain was actually better than the average annual return of 9% per year over five year. This could indicate that the company is winning over new investors, as it pursues its strategy. While it is well worth considering the different impacts that market conditions can have on the share price, there are other factors that are even more important. For instance, we've identified 3 warning signs for Eastman Chemical that you should be aware of.
伊士曼化工過去12個月的TSR爲14%。但是,這種回報率低於市場平均水平。好消息是,雖然它沒有達到市場平均水平,但其增長速度實際上比過去五年的年均9%更好。這可能表明,伊士曼化工正在吸引新投資者,並追求其戰略。 當然,伊士曼化工可能並不是買入最好的股票。因此,您可能希望查看這些免費的成長股票。
Of course Eastman Chemical may not be the best stock to buy. So you may wish to see this free collection of growth stocks.
除了股票價格的市場波動,還有其他更重要的因素需要考慮。例如,我們已經確定了三個警示信號,您需要注意伊士曼化工。當然,伊士曼化工可能不是最佳的股票,您可能希望查看這些免費的成長股票。
Please note, the market returns quoted in this article reflect the market weighted average returns of stocks that currently trade on American exchanges.
請注意,本文所引述的市場回報反映了目前在美國交易所上市的股票的市場加權平均回報。
Have feedback on this article? Concerned about the content? Get in touch with us directly. Alternatively, email editorial-team (at) simplywallst.com.
This article by Simply Wall St is general in nature. We provide commentary based on historical data and analyst forecasts only using an unbiased methodology and our articles are not intended to be financial advice. It does not constitute a recommendation to buy or sell any stock, and does not take account of your objectives, or your financial situation. We aim to bring you long-term focused analysis driven by fundamental data. Note that our analysis may not factor in the latest price-sensitive company announcements or qualitative material. Simply Wall St has no position in any stocks mentioned.
對本文有任何反饋?對內容有任何疑慮?請直接與我們聯繫。或者,發送電子郵件至editorial-team@simplywallst.com。
這篇文章是Simply Wall St的一般性文章。我們根據歷史數據和分析師預測提供評論,只使用公正的方法論,我們的文章並不意味着提供任何金融建議。文章不構成買賣任何股票的建議,也不考慮您的目標或您的財務狀況。我們的目標是帶給您基本數據驅動的長期關注分析。請注意,我們的分析可能不考慮最新的價格敏感公司公告或定性材料。Simply Wall St沒有任何股票頭寸。
Have feedback on this article? Concerned about the content? Get in touch with us directly. Alternatively, email editorial-team@simplywallst.com
對本文有任何反饋?對內容有任何疑慮?請直接與我們聯繫。或者,發送電子郵件至editorial-team@simplywallst.com。
譯文內容由第三人軟體翻譯。