
Earnings Growth of 4.1% Over 1 Year Hasn't Been Enough to Translate Into Positive Returns for Ulta Beauty (NASDAQ:ULTA) Shareholders
Earnings Growth of 4.1% Over 1 Year Hasn't Been Enough to Translate Into Positive Returns for Ulta Beauty (NASDAQ:ULTA) Shareholders
Investors can approximate the average market return by buying an index fund. While individual stocks can be big winners, plenty more fail to generate satisfactory returns. Investors in Ulta Beauty, Inc. (NASDAQ:ULTA) have tasted that bitter downside in the last year, as the share price dropped 15%. That contrasts poorly with the market return of 21%. On the other hand, the stock is actually up 14% over three years.
投資者可以購買指數基金來大致估計市場平均回報。雖然個別股票可以成爲大贏家,但更多的股票不能帶來令人滿意的回報。在過去的一年中,納斯達克(NASDAQ)上Ulta Beauty,Inc.(ULTA)的股價下跌了15%,這與市場回報率的21%形成了鮮明對比。另一方面,該股票的表現實際上在過去三年中上漲了14%。
After losing 5.3% this past week, it's worth investigating the company's fundamentals to see what we can infer from past performance.
在過去的一週中,股價下跌了5.3%,值得調查公司的基本面,以了解我們可以從過去的表現中得出什麼結論。
There is no denying that markets are sometimes efficient, but prices do not always reflect underlying business performance. One imperfect but simple way to consider how the market perception of a company has shifted is to compare the change in the earnings per share (EPS) with the share price movement.
不可否認的是,市場有時是高效的,但價格並不總是反映潛在的商業表現。一個不完美但簡單的方法來考慮公司市場感知如何改變是比較每股收益(EPS)變化和股價變動。
Even though the Ulta Beauty share price is down over the year, its EPS actually improved. Of course, the situation might betray previous over-optimism about growth.
儘管Ulta美容股票價格在一年中下跌了,但其每股收益實際上有所提高。當然,這種情況可能背叛了之前對增長的過度樂觀。
By glancing at these numbers, we'd posit that the the market had expectations of much higher growth, last year. But other metrics might shed some light on why the share price is down.
通過查看這些數字,我們可以假設去年市場對增長有更高的期望。但其他指標可能會解釋股價下跌的原因。
Ulta Beauty managed to grow revenue over the last year, which is usually a real positive. Since the fundamental metrics don't readily explain the share price drop, there might be an opportunity if the market has overreacted.
Ulta美容公司在過去一年中成功增加了營業收入,這通常是一個真正的積極因素。由於基本指標並不能很好地解釋股價下跌,如果市場反應過度,可能會有機會。
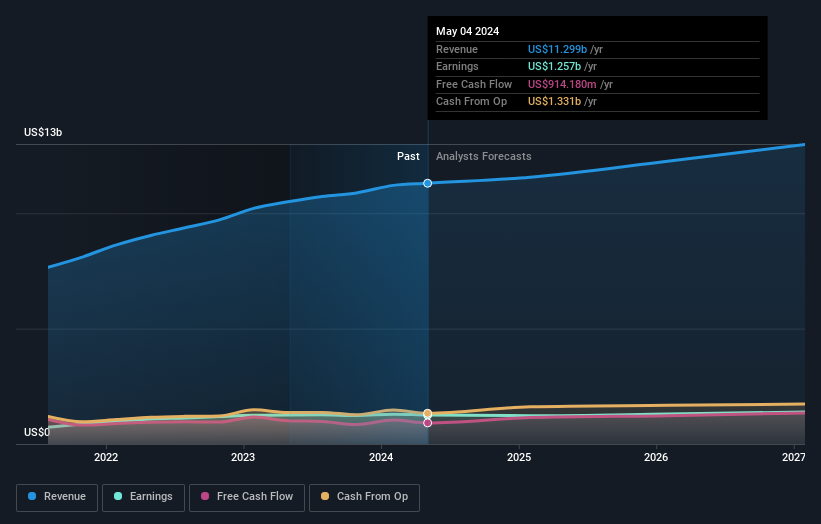
You can see how earnings and revenue have changed over time in the image below (click on the chart to see the exact values).
你可以在下面的圖片中看到收入和營業收入隨時間的變化情況(單擊圖表可查看精確值)。
Ulta Beauty is a well known stock, with plenty of analyst coverage, suggesting some visibility into future growth. Given we have quite a good number of analyst forecasts, it might be well worth checking out this free chart depicting consensus estimates.
Ulta美容是一家衆所周知的股票,得到了許多分析師的關注,這表明未來增長的一定程度的可見性。鑑於我們有相當數量的分析師預測,檢查這個免費的顯示共識估計的圖表可能非常值得。
A Different Perspective
不同的觀點
While the broader market gained around 21% in the last year, Ulta Beauty shareholders lost 15%. However, keep in mind that even the best stocks will sometimes underperform the market over a twelve month period. On the bright side, long term shareholders have made money, with a gain of 2% per year over half a decade. If the fundamental data continues to indicate long term sustainable growth, the current sell-off could be an opportunity worth considering. It's always interesting to track share price performance over the longer term. But to understand Ulta Beauty better, we need to consider many other factors. Consider for instance, the ever-present spectre of investment risk. We've identified 1 warning sign with Ulta Beauty , and understanding them should be part of your investment process.
雖然廣義市場在過去一年中獲得了大約21%的回報,但Ulta美容股東損失了15%。但請記住,即使是最好的股票在十二個月的時間內有時也會表現不佳。從好的一面來說,長期股東通過一年漲了2%,這是半個十年的收益。如果基本數據繼續表明長期可持續增長,當前的拋售可能是值得考慮的機會。跟蹤股價的長期表現總是有趣的。但要更好地了解Ulta Beauty,我們需要考慮許多其他因素。例如,投資風險的永恒威脅。我們已經發現了Ulta Beauty的1個警告跡象,並且理解它們應該是您投資過程的一部分。
If you are like me, then you will not want to miss this free list of undervalued small caps that insiders are buying.
如果您像我一樣,就不會希望錯過這份免費的內部人士正在購買的低估小市值股票列表。
Please note, the market returns quoted in this article reflect the market weighted average returns of stocks that currently trade on American exchanges.
請注意,本文所引述的市場回報反映了目前在美國交易所上市的股票的市場加權平均回報。
Have feedback on this article? Concerned about the content? Get in touch with us directly. Alternatively, email editorial-team (at) simplywallst.com.
This article by Simply Wall St is general in nature. We provide commentary based on historical data and analyst forecasts only using an unbiased methodology and our articles are not intended to be financial advice. It does not constitute a recommendation to buy or sell any stock, and does not take account of your objectives, or your financial situation. We aim to bring you long-term focused analysis driven by fundamental data. Note that our analysis may not factor in the latest price-sensitive company announcements or qualitative material. Simply Wall St has no position in any stocks mentioned.
對本文有任何反饋?對內容有任何疑慮?請直接與我們聯繫。或者,發送電子郵件至editorial-team@simplywallst.com。
這篇文章是Simply Wall St的一般性文章。我們根據歷史數據和分析師預測提供評論,只使用公正的方法論,我們的文章並不意味着提供任何金融建議。文章不構成買賣任何股票的建議,也不考慮您的目標或您的財務狀況。我們的目標是帶給您基本數據驅動的長期關注分析。請注意,我們的分析可能不考慮最新的價格敏感公司公告或定性材料。Simply Wall St沒有任何股票頭寸。
Have feedback on this article? Concerned about the content? Get in touch with us directly. Alternatively, email editorial-team@simplywallst.com
對本文有任何反饋?對內容有任何疑慮?請直接與我們聯繫。或者,發送電子郵件至editorial-team@simplywallst.com。
譯文內容由第三人軟體翻譯。