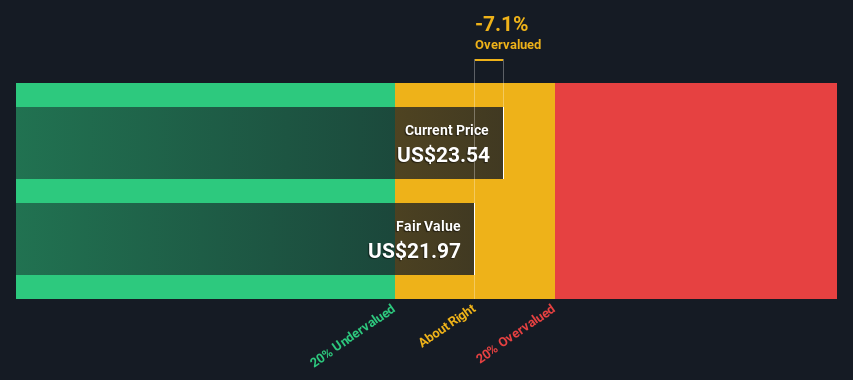
Using the 2 Stage Free Cash Flow to Equity, Expro Group Holdings fair value estimate is US$21.97
With US$23.54 share price, Expro Group Holdings appears to be trading close to its estimated fair value
Analyst price target for XPRO is US$25.29, which is 15% above our fair value estimate
Does the July share price for Expro Group Holdings N.V. (NYSE:XPRO) reflect what it's really worth? Today, we will estimate the stock's intrinsic value by estimating the company's future cash flows and discounting them to their present value. The Discounted Cash Flow (DCF) model is the tool we will apply to do this. It may sound complicated, but actually it is quite simple!
Companies can be valued in a lot of ways, so we would point out that a DCF is not perfect for every situation. Anyone interested in learning a bit more about intrinsic value should have a read of the Simply Wall St analysis model.
The Calculation
We're using the 2-stage growth model, which simply means we take in account two stages of company's growth. In the initial period the company may have a higher growth rate and the second stage is usually assumed to have a stable growth rate. To start off with, we need to estimate the next ten years of cash flows. Where possible we use analyst estimates, but when these aren't available we extrapolate the previous free cash flow (FCF) from the last estimate or reported value. We assume companies with shrinking free cash flow will slow their rate of shrinkage, and that companies with growing free cash flow will see their growth rate slow, over this period. We do this to reflect that growth tends to slow more in the early years than it does in later years.
Generally we assume that a dollar today is more valuable than a dollar in the future, so we need to discount the sum of these future cash flows to arrive at a present value estimate:
10-year free cash flow (FCF) estimate
2025
2026
2027
2028
2029
2030
2031
2032
2033
2034
Levered FCF ($, Millions)
US$150.6m
US$123.1m
US$146.2m
US$164.2m
US$170.4m
US$176.1m
US$181.5m
US$186.7m
US$191.7m
US$196.8m
Growth Rate Estimate Source
Analyst x3
Analyst x1
Analyst x1
Analyst x1
Est @ 3.78%
Est @ 3.36%
Est @ 3.06%
Est @ 2.86%
Est @ 2.72%
Est @ 2.61%
Present Value ($, Millions) Discounted @ 8.4%
US$139
US$105
US$115
US$119
US$114
US$109
US$103
US$97.9
US$92.8
US$87.9
("Est" = FCF growth rate estimated by Simply Wall St) Present Value of 10-year Cash Flow (PVCF) = US$1.1b
The second stage is also known as Terminal Value, this is the business's cash flow after the first stage. For a number of reasons a very conservative growth rate is used that cannot exceed that of a country's GDP growth. In this case we have used the 5-year average of the 10-year government bond yield (2.4%) to estimate future growth. In the same way as with the 10-year 'growth' period, we discount future cash flows to today's value, using a cost of equity of 8.4%.
Present Value of Terminal Value (PVTV)= TV / (1 + r)10= US$3.3b÷ ( 1 + 8.4%)10= US$1.5b
The total value, or equity value, is then the sum of the present value of the future cash flows, which in this case is US$2.6b. In the final step we divide the equity value by the number of shares outstanding. Relative to the current share price of US$23.5, the company appears around fair value at the time of writing. Remember though, that this is just an approximate valuation, and like any complex formula - garbage in, garbage out.
NYSE:XPRO Discounted Cash Flow July 20th 2024
The Assumptions
The calculation above is very dependent on two assumptions. The first is the discount rate and the other is the cash flows. You don't have to agree with these inputs, I recommend redoing the calculations yourself and playing with them. The DCF also does not consider the possible cyclicality of an industry, or a company's future capital requirements, so it does not give a full picture of a company's potential performance. Given that we are looking at Expro Group Holdings as potential shareholders, the cost of equity is used as the discount rate, rather than the cost of capital (or weighted average cost of capital, WACC) which accounts for debt. In this calculation we've used 8.4%, which is based on a levered beta of 1.308. Beta is a measure of a stock's volatility, compared to the market as a whole. We get our beta from the industry average beta of globally comparable companies, with an imposed limit between 0.8 and 2.0, which is a reasonable range for a stable business.
SWOT Analysis for Expro Group Holdings
Strength
Debt is not viewed as a risk.
Balance sheet summary for XPRO.
Weakness
Expensive based on P/S ratio and estimated fair value.
Shareholders have been diluted in the past year.
What are analysts forecasting for XPRO?
Opportunity
Expected to breakeven next year.
Has sufficient cash runway for more than 3 years based on current free cash flows.
Threat
No apparent threats visible for XPRO.
Moving On:
Although the valuation of a company is important, it shouldn't be the only metric you look at when researching a company. It's not possible to obtain a foolproof valuation with a DCF model. Preferably you'd apply different cases and assumptions and see how they would impact the company's valuation. For example, changes in the company's cost of equity or the risk free rate can significantly impact the valuation. For Expro Group Holdings, we've compiled three additional elements you should explore:
Risks: To that end, you should be aware of the 2 warning signs we've spotted with Expro Group Holdings .
Management:Have insiders been ramping up their shares to take advantage of the market's sentiment for XPRO's future outlook? Check out our management and board analysis with insights on CEO compensation and governance factors.
Other High Quality Alternatives: Do you like a good all-rounder? Explore our interactive list of high quality stocks to get an idea of what else is out there you may be missing!
PS. The Simply Wall St app conducts a discounted cash flow valuation for every stock on the NYSE every day. If you want to find the calculation for other stocks just search here.
Have feedback on this article? Concerned about the content?Get in touch with us directly. Alternatively, email editorial-team (at) simplywallst.com. This article by Simply Wall St is general in nature. We provide commentary based on historical data and analyst forecasts only using an unbiased methodology and our articles are not intended to be financial advice. It does not constitute a recommendation to buy or sell any stock, and does not take account of your objectives, or your financial situation. We aim to bring you long-term focused analysis driven by fundamental data. Note that our analysis may not factor in the latest price-sensitive company announcements or qualitative material. Simply Wall St has no position in any stocks mentioned.
Have feedback on this article? Concerned about the content? Get in touch with us directly. Alternatively, email editorial-team@simplywallst.com
主要見解
使用2階段自由現金流估算出的,Expro Group Holdings的公允價值爲21.97美元。
以23.54美元的股價計算,Expro Group Holdings的交易價格接近其估計的公允價值。
XPRO的分析師目標價爲25.29美元,比我們的公允價值估計高15%。
7月份Expro Group Holdings N.V. (NYSE:XPRO)的股票價格反映了其真正的價值嗎?今天,我們將通過估算公司未來的現金流並將其貼現到當前價值來估算股票的內在價值。折現現金流 (DCF) 模型是我們將應用的工具。它可能聽起來很複雜,但實際上很簡單!
上述計算非常依賴於兩個假設:第一個是貼現率,第二個是現金流。您不必同意這些輸入,我建議您重新計算並進行更改。DCF 也沒有考慮行業可能的週期性,也沒有考慮到公司未來的資本需求,因此不能給出公司潛在業績的完整圖片。鑑於我們正考慮成爲Expro Group Holdings的潛在股東,我們使用股本成本作爲貼現率,而不是資本成本(或加權平均資本成本,WACC),後者考慮了負債。在這個計算中,我們使用了8.4%,這是基於1.308的槓桿貝塔得出的。Beta 是衡量股票相對於整個市場波動性的指標。我們從全球可比公司的平均貝塔值中獲得我們的貝塔值,並設定了0.8到2.0的範圍限制,這是一個穩定經營企業的合理範圍。
Expro Group Holdings 的SWOT分析
優勢
債務不被視爲風險。
XPRO的資產負債表摘要。
弱點
基於市銷率和估算公允價值,IFF有些昂貴。
股東在過去一年中被稀釋。
分析師們對XPRO的預測是什麼?
機會
預計明年盈虧相抵。
根據當前自由現金流,財務運營資金足夠支撐三年以上。
威脅
XPRO 沒有明顯的威脅可見。
接下來:
雖然公司的估值很重要,但是在研究公司時不應該只看這一項指標。使用 DCF 模型無法得到完全可靠的估值。最好應用不同的情況和假設,看看它們如何影響公司的估值。例如,公司的權益成本或無風險利率的變化都可能會對估值產生重大影響。對於 Expro Group Holdings,我們編制了另外三個應該探索的要素: