
Is TAL Education Group (NYSE:TAL) Trading At A 49% Discount?
Is TAL Education Group (NYSE:TAL) Trading At A 49% Discount?
Key Insights
主要見解
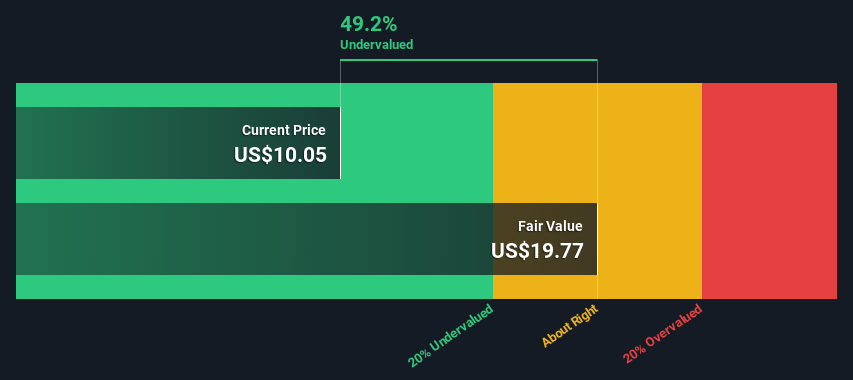
- TAL Education Group's estimated fair value is US$19.77 based on 2 Stage Free Cash Flow to Equity
- TAL Education Group is estimated to be 49% undervalued based on current share price of US$10.05
- Analyst price target for TAL is US$16.08 which is 19% below our fair value estimate
- 根據兩階段自由現金流估算,好未來集團的估值爲19.77美元。
- 基於當前股價10.05美元的估計,好未來集團被低估了49%。
- 分析師對好未來集團的目標價格爲16.08美元,比我們的公允價值估計低了19%。
In this article we are going to estimate the intrinsic value of TAL Education Group (NYSE:TAL) by taking the forecast future cash flows of the company and discounting them back to today's value. Our analysis will employ the Discounted Cash Flow (DCF) model. Don't get put off by the jargon, the math behind it is actually quite straightforward.
本文中,我們將通過對公司未來現金流量的預測並將其打折回今天的價值來估算好未來集團的內在價值。我們的分析將運用折現現金流(DCF)模型。別被行話嚇到了,其背後的數學實際上相當簡單。
We generally believe that a company's value is the present value of all of the cash it will generate in the future. However, a DCF is just one valuation metric among many, and it is not without flaws. For those who are keen learners of equity analysis, the Simply Wall St analysis model here may be something of interest to you.
我們通常認爲,一家公司的價值是其未來所有現金流的現值之和。然而,DCF僅是衆多估值指標之一,它並非沒有缺陷。對於那些熱衷於股權分析的學習者來說,在這裏,Simply Wall St分析模型可能值得一提。
What's The Estimated Valuation?
預估估值是多少?
We use what is known as a 2-stage model, which simply means we have two different periods of growth rates for the company's cash flows. Generally the first stage is higher growth, and the second stage is a lower growth phase. To start off with, we need to estimate the next ten years of cash flows. Where possible we use analyst estimates, but when these aren't available we extrapolate the previous free cash flow (FCF) from the last estimate or reported value. We assume companies with shrinking free cash flow will slow their rate of shrinkage, and that companies with growing free cash flow will see their growth rate slow, over this period. We do this to reflect that growth tends to slow more in the early years than it does in later years.
我們採用的是所謂的2階段模型,這意味着我們有兩個不同的現金流增長期。普遍情況下,第一階段是高增長,第二階段是低增長。首先,我們需要估計未來十年的現金流。在可能的情況下,我們使用分析師的估計,但當這些不可得時,我們從上一個估計或報告價值中推斷出前面的自由現金流(FCF)。我們假設自由現金流縮減的公司將減少其縮減率,而自由現金流增長的公司在此期間將看到其增長率放緩。我們這樣做是爲了反映增長在早期年份比後期年份更容易放緩。
A DCF is all about the idea that a dollar in the future is less valuable than a dollar today, so we discount the value of these future cash flows to their estimated value in today's dollars:
DCF的核心理念是未來的一美元價值不如現在的一美元,因此我們將這些未來現金流折現至今天的價值:
10-year free cash flow (FCF) estimate
10年自由現金流 (FCF) 預估值
| 2025 | 2026 | 2027 | 2028 | 2029 | 2030 | 2031 | 2032 | 2033 | 2034 | |
| Levered FCF ($, Millions) | US$371.5m | US$414.3m | US$495.0m | US$555.2m | US$606.4m | US$649.9m | US$687.2m | US$719.7m | US$748.6m | US$775.1m |
| Growth Rate Estimate Source | Analyst x4 | Analyst x4 | Analyst x3 | Est @ 12.16% | Est @ 9.23% | Est @ 7.17% | Est @ 5.73% | Est @ 4.73% | Est @ 4.02% | Est @ 3.53% |
| Present Value ($, Millions) Discounted @ 7.3% | US$346 | US$360 | US$401 | US$419 | US$426 | US$426 | US$420 | US$410 | US$397 | US$383 |
| 2025 | 2026 | 2027 | 2028 | 2029 | 2030 | 2031 | 2032 | 2033 | 2034 | |
| 槓桿自由現金流 ($, 百萬) | 3.715億美元 | 4.143億美元 | 4.95億美元 | 5.552億美元 | 6.064億美元 | 6.499億美元 | 6.872億美元 | 7.197億美元 | 7.486億美元 | 7.751億美元 |
| 創業板增長率預測來源 | 分析師4人 | 分析師4人 | 分析師x3 | 12.16%的估值 | 預測:9.23% | 預計增速爲7.17% | 以5.73%的速率增長 | 以4.73%的速率增長 | 以4.02%的速率增長 | 以3.53%的速率增長 |
| 以7.3%的折現率折現的現值($,百萬) | 346美元 | 美元360 | 美元401 | 419美元 | 426美元 | 426美元 | 420美元 | 410美元 | 397美元 | 383美元 |
("Est" = FCF growth rate estimated by Simply Wall St)
Present Value of 10-year Cash Flow (PVCF) = US$4.0b
("Est" = FCF增長率估計由Simply Wall St)
10年現金流的現值(PVCF)= 美元4.0b
After calculating the present value of future cash flows in the initial 10-year period, we need to calculate the Terminal Value, which accounts for all future cash flows beyond the first stage. The Gordon Growth formula is used to calculate Terminal Value at a future annual growth rate equal to the 5-year average of the 10-year government bond yield of 2.4%. We discount the terminal cash flows to today's value at a cost of equity of 7.3%.
在計算了最初10年未來現金流的現值後,我們需要計算終值,它代表了第一階段之後的所有未來現金流。 高登增長模型用於計算未來年增長率與10年期政府債券收益率的5年平均值相等的終值。 我們以7.3%的權益成本來折現終端現金流至今日的價值。
Terminal Value (TV)= FCF2034 × (1 + g) ÷ (r – g) = US$775m× (1 + 2.4%) ÷ (7.3%– 2.4%) = US$16b
終端價值(TV)= FCF2034 ×(1 + g)÷(r-g)= 7.75億美元×(1 + 2.4%)÷(7.3% - 2.4%)= 160億美元
Present Value of Terminal Value (PVTV)= TV / (1 + r)10= US$16b÷ ( 1 + 7.3%)10= US$8.0b
終端價值的現值(PVTV)= TV /(1 + r)10= 160億美元÷(1 + 7.3%)10= 80億美元
The total value is the sum of cash flows for the next ten years plus the discounted terminal value, which results in the Total Equity Value, which in this case is US$12b. In the final step we divide the equity value by the number of shares outstanding. Compared to the current share price of US$10.1, the company appears quite undervalued at a 49% discount to where the stock price trades currently. Remember though, that this is just an approximate valuation, and like any complex formula - garbage in, garbage out.
總價值是未來十年的現金流折現價值加上折現終端價值之和,結果是總權益價值,本例中爲120億美元。在最後一步中,我們將權益價值除以股票的已發行股份數。與當前股價10.1美元相比,公司顯然被低估了49%。不過請記住,這僅僅是一個近似的估值,就像任何複雜的公式一樣,垃圾進垃圾出。
The Assumptions
假設
We would point out that the most important inputs to a discounted cash flow are the discount rate and of course the actual cash flows. Part of investing is coming up with your own evaluation of a company's future performance, so try the calculation yourself and check your own assumptions. The DCF also does not consider the possible cyclicality of an industry, or a company's future capital requirements, so it does not give a full picture of a company's potential performance. Given that we are looking at TAL Education Group as potential shareholders, the cost of equity is used as the discount rate, rather than the cost of capital (or weighted average cost of capital, WACC) which accounts for debt. In this calculation we've used 7.3%, which is based on a levered beta of 0.873. Beta is a measure of a stock's volatility, compared to the market as a whole. We get our beta from the industry average beta of globally comparable companies, with an imposed limit between 0.8 and 2.0, which is a reasonable range for a stable business.
我們需要指出,折現現金流模型中最重要的輸入是折現率和實際現金流。投資的一部分是要對公司未來表現進行自己的評估,因此自己嘗試計算並檢查自己的假設很重要。DCF還不考慮行業可能的週期性,或公司未來的資本需求,因此它不能完全描繪公司的潛力表現。考慮到我們正在考慮成爲可能的股東的好未來集團,使用的折現率是權益成本,而不是資本成本(或加權平均資本成本,WACC),後者考慮了負債。在這個計算中,我們使用了7.3%,這基於0.873的帶槓桿beta。Beta是與整個市場相比,股票波動率的一個度量。我們從全球可比公司的行業平均beta中獲得beta,在0.8到2.0之間施加了一個限制,這是一個穩定企業的合理範圍。
Looking Ahead:
展望未來:
Whilst important, the DCF calculation is only one of many factors that you need to assess for a company. The DCF model is not a perfect stock valuation tool. Rather it should be seen as a guide to "what assumptions need to be true for this stock to be under/overvalued?" If a company grows at a different rate, or if its cost of equity or risk free rate changes sharply, the output can look very different. Can we work out why the company is trading at a discount to intrinsic value? For TAL Education Group, we've put together three essential items you should consider:
雖然DCF計算很重要,但只是您需要評估公司的衆多因素之一。DCF模型不是完美的股票估值工具。它應被視爲一個指導,用於“哪些假設需要成爲真實,才能使這隻股票低估或者高估?”如果公司以不同的速度增長,或者如果其權益成本或無風險率發生急劇變化,輸出可能會大大不同。我們能否找出爲什麼公司定價低於內在價值的原因呢?對於好未來集團,我們列出了三個必要的考慮項:
- Financial Health: Does TAL have a healthy balance sheet? Take a look at our free balance sheet analysis with six simple checks on key factors like leverage and risk.
- Future Earnings: How does TAL's growth rate compare to its peers and the wider market? Dig deeper into the analyst consensus number for the upcoming years by interacting with our free analyst growth expectation chart.
- Other High Quality Alternatives: Do you like a good all-rounder? Explore our interactive list of high quality stocks to get an idea of what else is out there you may be missing!
- 財務狀況:好未來是否擁有健康的資產負債表?請看我們的免費資產負債表分析,其中包括關鍵因素(如負債和風險)的六項簡單檢查。
- 未來收益:TAL的增長率與同行業和更廣泛市場的增長率如何進行比較?通過與我們的免費分析師增長預期圖表交互,深入了解未來幾年的分析師共識數。
- 其他高質量選擇:你喜歡一個好的多面手嗎?瀏覽我們的高質量股票交互列表,了解還有哪些你可能錯過的好東西!
PS. The Simply Wall St app conducts a discounted cash flow valuation for every stock on the NYSE every day. If you want to find the calculation for other stocks just search here.
PS。Simply Wall St應用程序每天爲紐約證券交易所的每隻股票進行折現現金流估值。如果您想查找其他股票的計算,請在此處搜索。
Have feedback on this article? Concerned about the content? Get in touch with us directly. Alternatively, email editorial-team (at) simplywallst.com.
This article by Simply Wall St is general in nature. We provide commentary based on historical data and analyst forecasts only using an unbiased methodology and our articles are not intended to be financial advice. It does not constitute a recommendation to buy or sell any stock, and does not take account of your objectives, or your financial situation. We aim to bring you long-term focused analysis driven by fundamental data. Note that our analysis may not factor in the latest price-sensitive company announcements or qualitative material. Simply Wall St has no position in any stocks mentioned.
對本文有任何反饋?對內容有任何疑慮?請直接與我們聯繫。或者,發送電子郵件至editorial-team@simplywallst.com。
這篇文章是Simply Wall St的一般性文章。我們根據歷史數據和分析師預測提供評論,只使用公正的方法論,我們的文章並不意味着提供任何金融建議。文章不構成買賣任何股票的建議,也不考慮您的目標或您的財務狀況。我們的目標是帶給您基本數據驅動的長期關注分析。請注意,我們的分析可能不考慮最新的價格敏感公司公告或定性材料。Simply Wall St沒有任何股票頭寸。
Have feedback on this article? Concerned about the content? Get in touch with us directly. Alternatively, email editorial-team@simplywallst.com
對本文有任何反饋?對內容有任何疑慮?請直接與我們聯繫。或者,發送電子郵件至editorial-team@simplywallst.com。
譯文內容由第三人軟體翻譯。