
Passive investing in index funds can generate returns that roughly match the overall market. But in our experience, buying the right stocks can give your wealth a significant boost. For example, the International Bancshares Corporation (NASDAQ:IBOC) share price is 77% higher than it was five years ago, which is more than the market average. It's also good to see a healthy gain of 34% in the last year.
On the back of a solid 7-day performance, let's check what role the company's fundamentals have played in driving long term shareholder returns.
To quote Buffett, 'Ships will sail around the world but the Flat Earth Society will flourish. There will continue to be wide discrepancies between price and value in the marketplace...' One imperfect but simple way to consider how the market perception of a company has shifted is to compare the change in the earnings per share (EPS) with the share price movement.
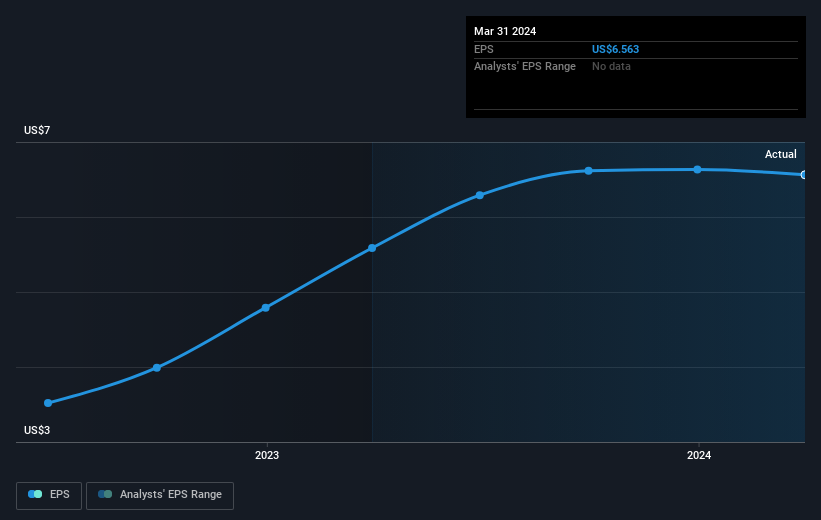
 Over half a decade, International Bancshares managed to grow its earnings per share at 15% a year. The EPS growth is more impressive than the yearly share price gain of 12% over the same period. So it seems the market isn't so enthusiastic about the stock these days. This cautious sentiment is reflected in its (fairly low) P/E ratio of 10.01.
You can see below how EPS has changed over time (discover the exact values by clicking on the image).
This free interactive report on International Bancshares' earnings, revenue and cash flow is a great place to start, if you want to investigate the stock further.
What About Dividends?
When looking at investment returns, it is important to consider the difference between total shareholder return (TSR) and share price return. The TSR is a return calculation that accounts for the value of cash dividends (assuming that any dividend received was reinvested) and the calculated value of any discounted capital raisings and spin-offs. Arguably, the TSR gives a more comprehensive picture of the return generated by a stock. In the case of International Bancshares, it has a TSR of 106% for the last 5 years. That exceeds its share price return that we previously mentioned. The dividends paid by the company have thusly boosted the total shareholder return.
A Different Perspective
We're pleased to report that International Bancshares shareholders have received a total shareholder return of 37% over one year. That's including the dividend. Since the one-year TSR is better than the five-year TSR (the latter coming in at 16% per year), it would seem that the stock's performance has improved in recent times. Given the share price momentum remains strong, it might be worth taking a closer look at the stock, lest you miss an opportunity. While it is well worth considering the different impacts that market conditions can have on the share price, there are other factors that are even more important. For example, we've discovered 1 warning sign for International Bancshares that you should be aware of before investing here.
But note: International Bancshares may not be the best stock to buy. So take a peek at this free list of interesting companies with past earnings growth (and further growth forecast).
Please note, the market returns quoted in this article reflect the market weighted average returns of stocks that currently trade on American exchanges.
Have feedback on this article? Concerned about the content? Get in touch with us directly. Alternatively, email editorial-team (at) simplywallst.com.
This article by Simply Wall St is general in nature. We provide commentary based on historical data and analyst forecasts only using an unbiased methodology and our articles are not intended to be financial advice. It does not constitute a recommendation to buy or sell any stock, and does not take account of your objectives, or your financial situation. We aim to bring you long-term focused analysis driven by fundamental data. Note that our analysis may not factor in the latest price-sensitive company announcements or qualitative material. Simply Wall St has no position in any stocks mentioned.
Have feedback on this article? Concerned about the content? Get in touch with us directly. Alternatively, email editorial-team@simplywallst.com