
We Like These Underlying Return On Capital Trends At Cigna Group (NYSE:CI)
We Like These Underlying Return On Capital Trends At Cigna Group (NYSE:CI)
Did you know there are some financial metrics that can provide clues of a potential multi-bagger? In a perfect world, we'd like to see a company investing more capital into its business and ideally the returns earned from that capital are also increasing. If you see this, it typically means it's a company with a great business model and plenty of profitable reinvestment opportunities. So on that note, Cigna Group (NYSE:CI) looks quite promising in regards to its trends of return on capital.
你知道有些財務指標可以提供潛在的多倍投資的線索嗎?在完美的世界裏,我們希望看到公司向業務投入更多資本,理想情況下這些資本所獲得的回報也在增加。如果出現這種情況,通常意味着這是一家擁有優秀商業模式且具有豐富盈利再投資機會的公司。就此而言,西格納集團(紐交所:CI)的資本回報率趨勢看起來非常可期。
What Is Return On Capital Employed (ROCE)?
我們對 Enphase Energy 的資本僱用回報率的看法:正如我們上面看到的,Enphase Energy 的資本回報率沒有提高,但它正在重新投資於業務。投資者必須認爲未來會有更好的前景,因爲股票表現良好,使持股五年以上的股東獲得了 690% 的收益。最終,如果基本趨勢持續存在,我們不會對它成爲一隻多頭股持有期很久很有信心。
For those who don't know, ROCE is a measure of a company's yearly pre-tax profit (its return), relative to the capital employed in the business. Analysts use this formula to calculate it for Cigna Group:
對於那些不知道的人,ROCE是一家公司的年利潤(即回報)與公司部分使用的資本相關的指標。分析師使用以下公式計算西格納集團的ROCE:
Return on Capital Employed = Earnings Before Interest and Tax (EBIT) ÷ (Total Assets - Current Liabilities)
資產僱用回報率(ROCE)是指企業利潤,即企業稅前利潤除以企業投入的總資本(負債加股權)。如果ROCE高於企業財務成本的承受能力,那麼企業就會創造出更多的價值。
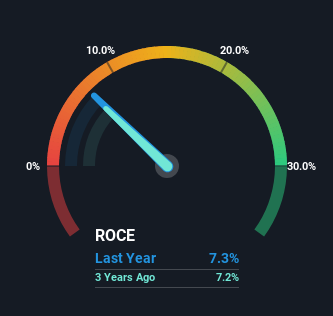
0.073 = US$7.4b ÷ (US$153b - US$52b) (Based on the trailing twelve months to March 2024).
0.073 = 74億美元 ÷ (1530億美元 - 52億美元)(基於過去 12 個月至 2024 年 3 月)。
So, Cigna Group has an ROCE of 7.3%. In absolute terms, that's a low return and it also under-performs the Healthcare industry average of 11%.
因此,西格納集團的ROCE爲7.3%。絕對來看,ROCE較低且低於醫療保健行業平均值的11%。
In the above chart we have measured Cigna Group's prior ROCE against its prior performance, but the future is arguably more important. If you'd like, you can check out the forecasts from the analysts covering Cigna Group for free.
在上圖中,我們比較了西格納集團先前的ROCE和其先前的表現,但未來可能更重要。如果您願意,您可以免費查看分析師對西格納集團的預測。
What The Trend Of ROCE Can Tell Us
儘管如此,當我們看 enphase energy (納斯達克股票代碼:ENPH) 的時候,它似乎並沒有完全符合這些要求。
Cigna Group's ROCE growth is quite impressive. Looking at the data, we can see that even though capital employed in the business has remained relatively flat, the ROCE generated has risen by 51% over the last five years. Basically the business is generating higher returns from the same amount of capital and that is proof that there are improvements in the company's efficiencies. On that front, things are looking good so it's worth exploring what management has said about growth plans going forward.
西格納集團的ROCE增長非常令人印象深刻。從數據來看,即使業務中使用的資本保持相對穩定,過去五年中產生的ROCE增長了51%。基本上,該業務從相同數量的資本獲得了更高的回報,這證明公司的效率有所提高。就此而言,情況看起來很好,因此值得探索管理層有關未來增長計劃的聲明。
On a side note, we noticed that the improvement in ROCE appears to be partly fueled by an increase in current liabilities. Effectively this means that suppliers or short-term creditors are now funding 34% of the business, which is more than it was five years ago. Keep an eye out for future increases because when the ratio of current liabilities to total assets gets particularly high, this can introduce some new risks for the business.
順便說一下,我們注意到ROCE的改善似乎部分是由當前負債增加引起的。有效地,這意味着供應商或短期債權人現在資助公司的34%,比五年前高了。要密切注意未來的增長,因爲噹噹前負債與總資產的比率特別高時,這可能會爲公司引入一些新的風險。
The Bottom Line On Cigna Group's ROCE
關於西格納集團的ROCE底線
As discussed above, Cigna Group appears to be getting more proficient at generating returns since capital employed has remained flat but earnings (before interest and tax) are up. And a remarkable 110% total return over the last five years tells us that investors are expecting more good things to come in the future. With that being said, we still think the promising fundamentals mean the company deserves some further due diligence.
正如上文所述,西格納集團似乎越來越能有效地產生回報,因爲資本保持不變,但收益(不包括利息和稅前收入)增加了。 而過去五年的驚人的110%的總回報告訴我們,投資者期望將來會有更多好事發生。 說完這些,我們仍然認爲,既然業績看起來很有前途,公司就值得進一步盡職調查。
If you'd like to know about the risks facing Cigna Group, we've discovered 3 warning signs that you should be aware of.
如果您想了解面臨西格納集團的風險,我們已經發現了3個警告信號,您應該注意。
If you want to search for solid companies with great earnings, check out this free list of companies with good balance sheets and impressive returns on equity.
如果您想尋找財務狀況良好、回報卓越的實力強企業,可以免費查看以下公司列表。
Have feedback on this article? Concerned about the content? Get in touch with us directly. Alternatively, email editorial-team (at) simplywallst.com.
This article by Simply Wall St is general in nature. We provide commentary based on historical data and analyst forecasts only using an unbiased methodology and our articles are not intended to be financial advice. It does not constitute a recommendation to buy or sell any stock, and does not take account of your objectives, or your financial situation. We aim to bring you long-term focused analysis driven by fundamental data. Note that our analysis may not factor in the latest price-sensitive company announcements or qualitative material. Simply Wall St has no position in any stocks mentioned.
對本文有任何反饋?對內容有任何疑慮?請直接與我們聯繫。或者,發送電子郵件至editorial-team@simplywallst.com。
這篇文章是Simply Wall St的一般性文章。我們根據歷史數據和分析師預測提供評論,只使用公正的方法論,我們的文章並不意味着提供任何金融建議。文章不構成買賣任何股票的建議,也不考慮您的目標或您的財務狀況。我們的目標是帶給您基本數據驅動的長期關注分析。請注意,我們的分析可能不考慮最新的價格敏感公司公告或定性材料。Simply Wall St沒有任何股票頭寸。
Have feedback on this article? Concerned about the content? Get in touch with us directly. Alternatively, email editorial-team@simplywallst.com
對本文有任何反饋?對內容有任何疑慮?請直接與我們聯繫。或者,發送電子郵件至editorial-team@simplywallst.com。
譯文內容由第三人軟體翻譯。