
Johnson & Johnson: Bullish Charts Signal Strong Setup Before Q2 Earnings
Johnson & Johnson: Bullish Charts Signal Strong Setup Before Q2 Earnings
Johnson & Johnson (NYSE:JNJ) is reporting its second-quarter earnings on Wednesday. Wall Street expects $2.7 in EPS and $22.3 billion in revenues as the company reports before market hours.
Johnson & Johnson (NYSE:JNJ)將於週三發佈第二季度業績報告。華爾街預計公司報告市場開盤前每股收益爲2.7美元,營收爲223億美元。
The stock is down 5.56% over the past year, -4.16% YTD.
該股票過去一年下跌了5.56%,年初至今下跌了4.16%。
Let's look at what the charts indicate for Johnson & Johnson stock and how the stock currently maps against Wall Street estimates.
讓我們查看一下Johnson & Johnson股票的圖表展示以及股票當前如何映射華爾街的預估。
Johnson & Johnson Technical Setup Ahead Of Q2 Earnings
Johnson & Johnson Q2盈利前技術啓示
Johnson & Johnson stock is exhibiting a strongly bullish trend, as its share price is above the 5-, 20-, and 50-day exponential moving averages.
Johnson & Johnson的股票展現出強勁的看好趨勢,因爲其股價高於5天、20天和50天的指數移動平均線。
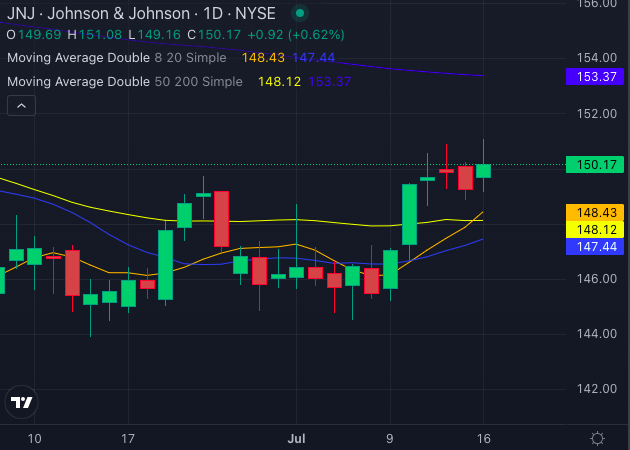
Chart created using Benzinga Pro
使用Benzinga Pro創建的圖表
Currently priced at $150.17, the stock is trading above its 8-day simple moving average (SMA) of $148.43, its 20-day SMA of $147.44, and its 50-day SMA of $148.12, all of which are bullish indicators.
目前股票報價爲150.17美元,交易價格高於其8天簡單移動平均線(SMA)的148.43美元,20天SMA的147.44美元和50天SMA的148.12美元,所有這些都是看好的因子。
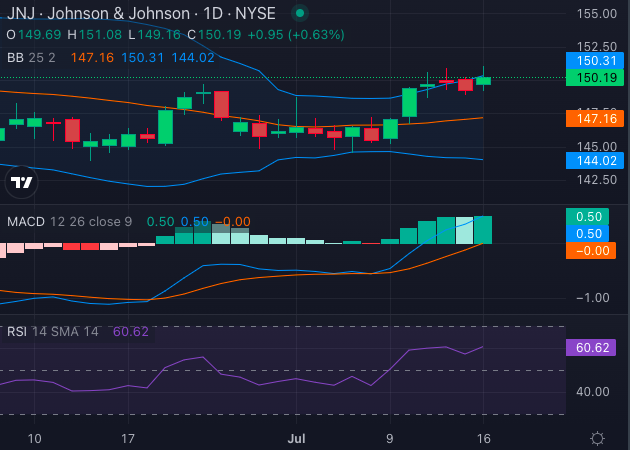
Chart created using Benzinga Pro
使用Benzinga Pro創建的圖表
The Moving Average Convergence Divergence (MACD) indicator also suggests a bullish outlook with a reading of 0.50. However, some caution is warranted due to slight selling pressure and its price being below the 200-day SMA of $153.37, which is a bearish signal.
移動平均線收斂-發散(MACD)指標也表明看好前景,讀數爲0.50。不過,由於存在輕微的賣壓以及其價格低於153.37美元的200天SMA,這是一個看淡的信號,需謹慎。
Additionally, the Relative Strength Index (RSI) at 60.62 indicates the stock is heading towards the Overbought territory, while Bollinger Bands (25) suggest a bullish signal, with the stock trading near the upper bound of $150.31.
此外,相對強度指數(RSI)爲60.62,表明股票正在走向超買區域,而布林帶(25)則表明股票交易接近150.31美元的上限,發出看好信號。
Read Also: How To Earn $500 A Month From Johnson & Johnson Stock Ahead Of Q2 Earnings
閱讀:如何在Johnson & Johnson Q2盈利前從該股票中賺取每月500美元
Johnson & Johnson Analysts Consensus Ratings
Johnson & Johnson分析師一致評級
Ratings & Consensus Estimates: The consensus analyst rating on Johnson & Johnson stock stands at a Neutral currently with a price target of $171.24. However, the three most recent analyst ratings for the stock were released by Cantor Fitzgerald on July 1, June 25, and June 20, 2024. These ratings have an average price target of $215, suggesting an implied upside of 43.21% for the stock.
評級和一致預估:目前,Johnson & Johnson股票的一致分析師評級爲中立,目標價格爲171.24美元。然而,股票的最新三個分析師評級分別於2024年7月1日、6月25日和6月20日發佈。這些評級的平均目標價格爲215美元,暗示該股票存在43.21%的上漲空間。
JNJ Price Action: Johnson & Johnson stock was trading up 0.84% at $150.50 at the time of publication Tuesday.
JNJ價格走勢:截至週二發佈時,Johnson & Johnson股票以150.50美元的漲幅0.84%交易。
- Johnson & Johnson Faces MedTech Challenges But Is 'On Track' To Meet 2024 Guidance: Goldman Sachs
- 強生公司面臨醫療技術挑戰,但高盛稱其“在趕進度”,以滿足2024年指引。
Photo: Shutterstock
Photo: shutterstock
譯文內容由第三人軟體翻譯。