
Earnings Growth Outpaced the Favorable 19% CAGR Delivered to Credicorp (NYSE:BAP) Shareholders Over the Last Three Years
Earnings Growth Outpaced the Favorable 19% CAGR Delivered to Credicorp (NYSE:BAP) Shareholders Over the Last Three Years
By buying an index fund, investors can approximate the average market return. But if you choose individual stocks with prowess, you can make superior returns. Just take a look at Credicorp Ltd. (NYSE:BAP), which is up 47%, over three years, soundly beating the market return of 20% (not including dividends). However, more recent returns haven't been as impressive as that, with the stock returning just 16% in the last year, including dividends.
通過購買指數基金,投資者可以近似獲得市場平均回報。但是,如果您選擇具有優勢的個股,可以獲得更高的回報率。只需看看Credicorp Ltd.(紐交所:BAP),其回報率已經達到47%,超過了三年內20%的市場回報率(不包括股息)。然而,更近期的回報並沒有那麼令人印象深刻,包括股息在內,股票在過去一年僅回報16%。
The past week has proven to be lucrative for Credicorp investors, so let's see if fundamentals drove the company's three-year performance.
過去一週對Credicorp的投資者而言是獲利豐厚的,因此讓我們看看基本面是否推動了該公司的三年表現。
To paraphrase Benjamin Graham: Over the short term the market is a voting machine, but over the long term it's a weighing machine. One imperfect but simple way to consider how the market perception of a company has shifted is to compare the change in the earnings per share (EPS) with the share price movement.
爲了概述本傑明·格雷厄姆(Benjamin Graham)的話:短期內,市場是一臺投票機,但長期來看,它是一臺衡重機。思考一家公司的市場感知如何轉變的一種不完美但簡單的方法是將每股收益(EPS)變化與股價變動進行比較。
During three years of share price growth, Credicorp achieved compound earnings per share growth of 84% per year. This EPS growth is higher than the 14% average annual increase in the share price. So it seems investors have become more cautious about the company, over time. This cautious sentiment is reflected in its (fairly low) P/E ratio of 10.16.
在三年的股價增長期間,Credicorp實現了84%的每股收益複合增長率。這種每股收益(EPS)增長高於股價的14%的年均增長率,因此隨着時間的推移,投資者似乎更加謹慎。這種謹慎的情緒反映在其(相當低的)市盈率爲10.16上。
The company's earnings per share (over time) is depicted in the image below (click to see the exact numbers).
該公司的每股收益(隨時間的推移)如下圖所示(單擊可查看確切數字)。
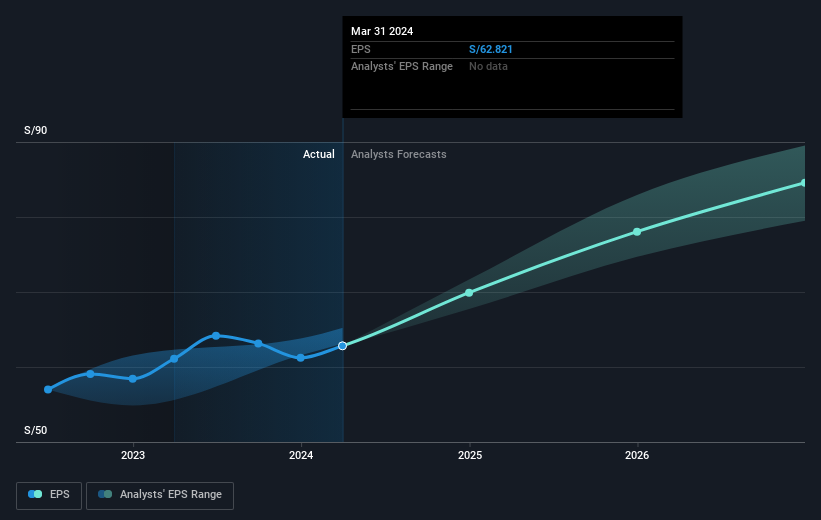
We know that Credicorp has improved its bottom line over the last three years, but what does the future have in store? It might be well worthwhile taking a look at our free report on how its financial position has changed over time.
我們知道Credicorp在過去三年中改善了其底線,但未來會發生什麼呢?看一下我們免費的報告,了解其財務狀況如何隨時間變化。
What About Dividends?
那麼分紅怎麼樣呢?
As well as measuring the share price return, investors should also consider the total shareholder return (TSR). The TSR incorporates the value of any spin-offs or discounted capital raisings, along with any dividends, based on the assumption that the dividends are reinvested. It's fair to say that the TSR gives a more complete picture for stocks that pay a dividend. In the case of Credicorp, it has a TSR of 70% for the last 3 years. That exceeds its share price return that we previously mentioned. And there's no prize for guessing that the dividend payments largely explain the divergence!
除了測量股價回報率外,投資者還應考慮總股東回報率(TSR)。 TSR包括任何股份分拆或資本募集折扣的價值,以及任何股息,基於股息再投資的假設。可以說TSR爲支付股息的股票提供了更完整的圖景。對於Credicorp而言,其過去3年的TSR爲70%。這超過了我們先前提到的股價回報,而且毫無疑問股息付款在很大程度上解釋了這種分歧!
A Different Perspective
不同的觀點
Credicorp provided a TSR of 16% over the last twelve months. Unfortunately this falls short of the market return. On the bright side, that's still a gain, and it is certainly better than the yearly loss of about 1.2% endured over half a decade. So this might be a sign the business has turned its fortunes around. It's always interesting to track share price performance over the longer term. But to understand Credicorp better, we need to consider many other factors. Take risks, for example - Credicorp has 1 warning sign we think you should be aware of.
Credicorp在過去12個月中提供了16%的TSR。不幸的是,這還沒有達到市場回報。好的一面是,這仍然是收益,且肯定比五年中遭受的約1.2%的年度虧損要好。因此,這可能是公司轉運的跡象。長期跟蹤股價表現總是很有趣的,但要更好地了解Credicorp,我們需要考慮更多的因素。例如,承擔風險-Credicorp有1個警告標誌,我們認爲您應該注意。
We will like Credicorp better if we see some big insider buys. While we wait, check out this free list of undervalued stocks (mostly small caps) with considerable, recent, insider buying.
如果我們看到一些大型內部人員購買,我們就會更喜歡Credicorp。在我們等待的同時,請查看此免費的低估股票列表(主要是小市值股票),其中涉及相當大量的內部購買。
Please note, the market returns quoted in this article reflect the market weighted average returns of stocks that currently trade on American exchanges.
請注意,本文所引述的市場回報反映了目前在美國交易所上市的股票的市場加權平均回報。
Have feedback on this article? Concerned about the content? Get in touch with us directly. Alternatively, email editorial-team (at) simplywallst.com.
This article by Simply Wall St is general in nature. We provide commentary based on historical data and analyst forecasts only using an unbiased methodology and our articles are not intended to be financial advice. It does not constitute a recommendation to buy or sell any stock, and does not take account of your objectives, or your financial situation. We aim to bring you long-term focused analysis driven by fundamental data. Note that our analysis may not factor in the latest price-sensitive company announcements or qualitative material. Simply Wall St has no position in any stocks mentioned.
對本文有任何反饋?對內容有任何疑慮?請直接與我們聯繫。或者,發送電子郵件至editorial-team@simplywallst.com。
這篇文章是Simply Wall St的一般性文章。我們根據歷史數據和分析師預測提供評論,只使用公正的方法論,我們的文章並不意味着提供任何金融建議。文章不構成買賣任何股票的建議,也不考慮您的目標或您的財務狀況。我們的目標是帶給您基本數據驅動的長期關注分析。請注意,我們的分析可能不考慮最新的價格敏感公司公告或定性材料。Simply Wall St沒有任何股票頭寸。
Have feedback on this article? Concerned about the content? Get in touch with us directly. Alternatively, email editorial-team@simplywallst.com
對本文有任何反饋?對內容有任何疑慮?請直接與我們聯繫。或者,發送電子郵件至editorial-team@simplywallst.com。
譯文內容由第三人軟體翻譯。