
The Past Five Years for Franklin Resources (NYSE:BEN) Investors Has Not Been Profitable
The Past Five Years for Franklin Resources (NYSE:BEN) Investors Has Not Been Profitable
In order to justify the effort of selecting individual stocks, it's worth striving to beat the returns from a market index fund. But the main game is to find enough winners to more than offset the losers So we wouldn't blame long term Franklin Resources, Inc. (NYSE:BEN) shareholders for doubting their decision to hold, with the stock down 35% over a half decade.
爲了證明選擇個股的努力是合理的,值得努力超過市場指數基金的回報。但是主要的遊戲是找到足夠的贏家來抵消輸家。因此,我們不會責怪富蘭克林資源公司(紐約證券交易所代碼:BEN)的長期股東懷疑他們的持股決定,該股在五年內下跌了35%。
Since shareholders are down over the longer term, lets look at the underlying fundamentals over the that time and see if they've been consistent with returns.
由於從長遠來看,股東會下跌,讓我們來看看那段時間的潛在基本面,看看它們與回報是否一致。
To quote Buffett, 'Ships will sail around the world but the Flat Earth Society will flourish. There will continue to be wide discrepancies between price and value in the marketplace...' One imperfect but simple way to consider how the market perception of a company has shifted is to compare the change in the earnings per share (EPS) with the share price movement.
引用巴菲特的話說:“船隻將在世界各地航行,但Flat Earth Society將蓬勃發展。市場上的價格和價值之間將繼續存在巨大差異...”考慮市場對公司的看法發生了怎樣的變化的一種不完美但簡單的方法是將每股收益(EPS)的變化與股價走勢進行比較。
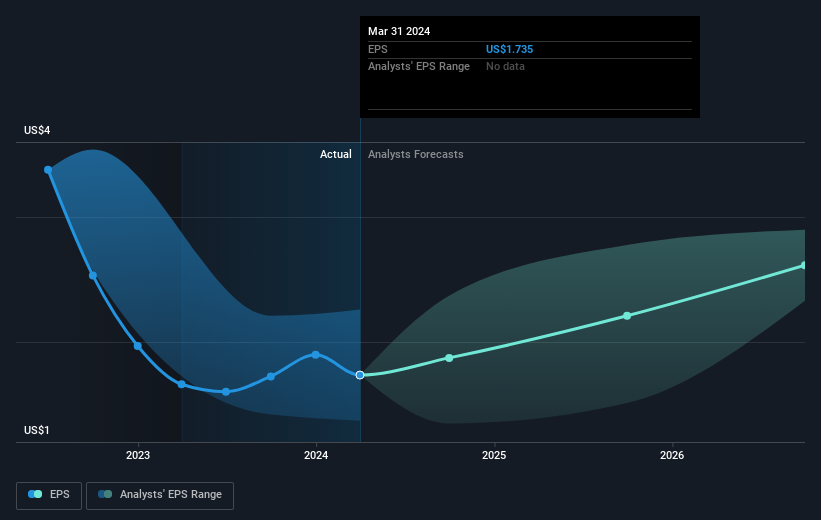
During the five years over which the share price declined, Franklin Resources' earnings per share (EPS) dropped by 11% each year. This fall in the EPS is worse than the 8% compound annual share price fall. The relatively muted share price reaction might be because the market expects the business to turn around.
在股價下跌的五年中,富蘭克林資源的每股收益(EPS)每年下降11%。每股收益的下降比8%的複合年股價下跌還要嚴重。股價反應相對平淡,可能是因爲市場預計業務將好轉。
The image below shows how EPS has tracked over time (if you click on the image you can see greater detail).
下圖顯示了 EPS 在一段時間內的跟蹤情況(如果你點擊圖片,你可以看到更多細節)。
It's probably worth noting we've seen significant insider buying in the last quarter, which we consider a positive. On the other hand, we think the revenue and earnings trends are much more meaningful measures of the business. Dive deeper into the earnings by checking this interactive graph of Franklin Resources' earnings, revenue and cash flow.
可能值得注意的是,我們在上個季度看到了大量的內幕買盤,我們認爲這是積極的。另一方面,我們認爲收入和收益趨勢是衡量業務的更有意義的指標。查看這張富蘭克林資源收益、收入和現金流的交互式圖表,深入了解收益。
What About Dividends?
分紅呢?
It is important to consider the total shareholder return, as well as the share price return, for any given stock. Whereas the share price return only reflects the change in the share price, the TSR includes the value of dividends (assuming they were reinvested) and the benefit of any discounted capital raising or spin-off. So for companies that pay a generous dividend, the TSR is often a lot higher than the share price return. We note that for Franklin Resources the TSR over the last 5 years was -18%, which is better than the share price return mentioned above. This is largely a result of its dividend payments!
重要的是要考慮任何給定股票的股東總回報率和股價回報率。儘管股價回報率僅反映股價的變化,但股東總回報率包括股息的價值(假設已進行再投資)以及任何折扣融資或分拆的收益。因此,對於支付豐厚股息的公司來說,股東總回報率通常遠高於股價回報率。我們注意到,富蘭克林資源在過去5年的股東總回報率爲-18%,好於上述股價回報率。這在很大程度上是其股息支付的結果!
A Different Perspective
不同的視角
Franklin Resources shareholders are down 17% for the year (even including dividends), but the market itself is up 24%. However, keep in mind that even the best stocks will sometimes underperform the market over a twelve month period. Unfortunately, last year's performance may indicate unresolved challenges, given that it was worse than the annualised loss of 3% over the last half decade. Generally speaking long term share price weakness can be a bad sign, though contrarian investors might want to research the stock in hope of a turnaround. It's always interesting to track share price performance over the longer term. But to understand Franklin Resources better, we need to consider many other factors. For instance, we've identified 3 warning signs for Franklin Resources that you should be aware of.
富蘭克林資源的股東今年下跌了17%(甚至包括股息),但市場本身上漲了24%。但是,請記住,即使是最好的股票有時也會在十二個月內表現不如市場。不幸的是,去年的表現可能預示着尚未解決的挑戰,因爲它比過去五年中3%的年化虧損還要糟糕。總的來說,長期股價疲軟可能是一個壞兆頭,儘管逆勢投資者可能希望研究該股以期出現轉機。長期跟蹤股價表現總是很有意思的。但是,爲了更好地了解富蘭克林資源,我們需要考慮許多其他因素。例如,我們已經確定了富蘭克林資源的3個警告信號,你應該注意這些信號。
If you like to buy stocks alongside management, then you might just love this free list of companies. (Hint: most of them are flying under the radar).
如果你想和管理層一起購買股票,那麼你可能會喜歡這份免費的公司清單。(提示:它們中的大多數都在雷達下飛行)。
Please note, the market returns quoted in this article reflect the market weighted average returns of stocks that currently trade on American exchanges.
請注意,本文引用的市場回報反映了目前在美國交易所交易的股票的市場加權平均回報。
Have feedback on this article? Concerned about the content? Get in touch with us directly. Alternatively, email editorial-team (at) simplywallst.com.
This article by Simply Wall St is general in nature. We provide commentary based on historical data and analyst forecasts only using an unbiased methodology and our articles are not intended to be financial advice. It does not constitute a recommendation to buy or sell any stock, and does not take account of your objectives, or your financial situation. We aim to bring you long-term focused analysis driven by fundamental data. Note that our analysis may not factor in the latest price-sensitive company announcements or qualitative material. Simply Wall St has no position in any stocks mentioned.
對這篇文章有反饋嗎?對內容感到擔憂嗎?請直接聯繫我們。或者,也可以發送電子郵件至編輯團隊 (at) simplywallst.com。
Simply Wall St的這篇文章本質上是籠統的。我們僅使用公正的方法根據歷史數據和分析師的預測提供評論,我們的文章無意作爲財務建議。它不構成買入或賣出任何股票的建議,也沒有考慮到您的目標或財務狀況。我們的目標是爲您提供由基本數據驅動的長期重點分析。請注意,我們的分析可能不考慮最新的價格敏感型公司公告或定性材料。簡而言之,華爾街沒有持有任何上述股票的頭寸。
Have feedback on this article? Concerned about the content? Get in touch with us directly. Alternatively, email editorial-team@simplywallst.com
對這篇文章有反饋嗎?擔心內容嗎?直接聯繫我們。或者,發送電子郵件至 editorial-team@simplywallst.com
譯文內容由第三人軟體翻譯。