
Valvoline's (NYSE:VVV) 19% CAGR Outpaced the Company's Earnings Growth Over the Same Five-year Period
Valvoline's (NYSE:VVV) 19% CAGR Outpaced the Company's Earnings Growth Over the Same Five-year Period
When you buy a stock there is always a possibility that it could drop 100%. But on the bright side, you can make far more than 100% on a really good stock. One great example is Valvoline Inc. (NYSE:VVV) which saw its share price drive 122% higher over five years. In more good news, the share price has risen 10% in thirty days.
買股票時總存在100%的下跌可能性,但好消息是,好股還可以賺到遠高於100%的收益。其中一個很好的例子便是勝牌公司(NYSE:VVV),其股價在五年內增長了122%。更好的消息是,股價在30天內上漲了10%。
Since it's been a strong week for Valvoline shareholders, let's have a look at trend of the longer term fundamentals.
既然勝牌公司的股東在這一週表現良好,讓我們來看一下更長期基本面的趨勢。
While the efficient markets hypothesis continues to be taught by some, it has been proven that markets are over-reactive dynamic systems, and investors are not always rational. One flawed but reasonable way to assess how sentiment around a company has changed is to compare the earnings per share (EPS) with the share price.
雖然一些人仍然在教授高效市場假說,但已經證明市場是過度反應的動態系統,投資者不總是理性的。一種有缺陷但合理的評估公司情緒變化的方法是比較每股收益 (EPS) 與股價。
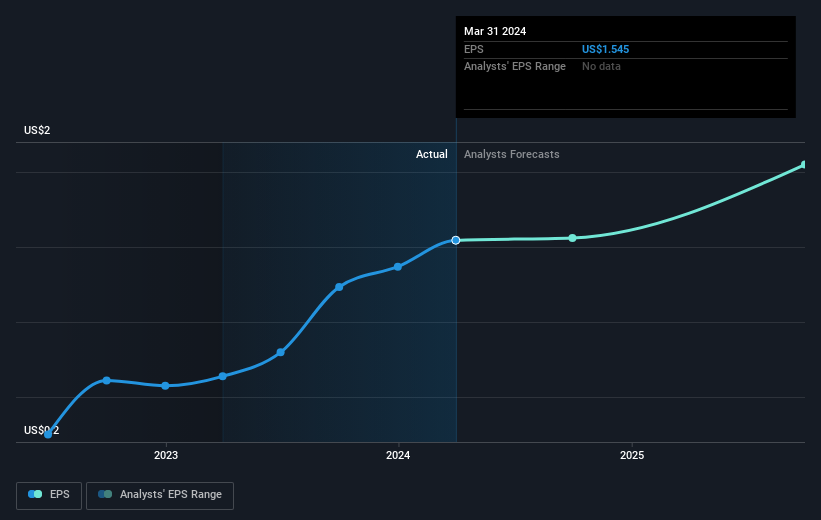
Over half a decade, Valvoline managed to grow its earnings per share at 7.4% a year. This EPS growth is lower than the 17% average annual increase in the share price. This suggests that market participants hold the company in higher regard, these days. That's not necessarily surprising considering the five-year track record of earnings growth.
在過去的五年中,勝牌公司的每股收益增長率爲7.4%。這個數據較低,相比於股價平均年增長率17%。這意味着市場參與者認爲目前公司更有價值,這並不令人意外,考慮到公司在過去五年的盈利增長記錄。
You can see below how EPS has changed over time (discover the exact values by clicking on the image).
下面可以看到每股收益隨時間的變化情況(通過點擊圖像來查看確切數值)。
We consider it positive that insiders have made significant purchases in the last year. Even so, future earnings will be far more important to whether current shareholders make money. This free interactive report on Valvoline's earnings, revenue and cash flow is a great place to start, if you want to investigate the stock further.
我們認爲公司內部人士在過去一年中進行了大量購買,這是積極的。即便如此,未來的盈利對於當前股東是否獲利則更爲重要。如果你想進一步調查該股,勝牌公司的盈利、營業收入和現金流的免費交互式報告是一個很好的起點。
What About The Total Shareholder Return (TSR)?
那麼,股東總回報(TSR)呢?
We'd be remiss not to mention the difference between Valvoline's total shareholder return (TSR) and its share price return. The TSR is a return calculation that accounts for the value of cash dividends (assuming that any dividend received was reinvested) and the calculated value of any discounted capital raisings and spin-offs. Its history of dividend payouts mean that Valvoline's TSR of 137% over the last 5 years is better than the share price return.
我們不得不提到勝牌公司總股東回報(TSR)和股價回報之間的差異。TSR是一種回報計算方式,它考慮了現金股利的價值(假設任何收到的股息都會再投資),以及任何折扣資本籌資和股份剝離的計算價值。由於有股息支付歷史,所以勝牌公司在過去5年的TSR爲137%,比股價回報更好。
A Different Perspective
不同的觀點
Valvoline provided a TSR of 17% over the last twelve months. Unfortunately this falls short of the market return. If we look back over five years, the returns are even better, coming in at 19% per year for five years. Maybe the share price is just taking a breather while the business executes on its growth strategy. I find it very interesting to look at share price over the long term as a proxy for business performance. But to truly gain insight, we need to consider other information, too. To that end, you should be aware of the 2 warning signs we've spotted with Valvoline .
勝牌在過去的12個月裏提供了17%的TSR。不幸的是,這遠低於市場回報。如果我們回顧五年,回報會更好,達到每年19%的水平。也許股價只是在業務執行其增長策略的時候稍事休息。把股價視爲業務表現的代理是非常有趣的長期觀察方法,但爲了真正獲得見解,我們還需要考慮其他信息。爲此,您應該意識到我們在勝牌發現的2個警告信號。
Valvoline is not the only stock insiders are buying. So take a peek at this free list of small cap companies at attractive valuations which insiders have been buying.
勝牌公司不是唯一一家內部人士購買的股票。因此,可以看一下這個免費的小盤公司估值列表,裏面有吸引力的公司股價,其內部人士一直在購買。
Please note, the market returns quoted in this article reflect the market weighted average returns of stocks that currently trade on American exchanges.
請注意,本文所引述的市場回報反映了目前在美國交易所上市的股票的市場加權平均回報。
Have feedback on this article? Concerned about the content? Get in touch with us directly. Alternatively, email editorial-team (at) simplywallst.com.
This article by Simply Wall St is general in nature. We provide commentary based on historical data and analyst forecasts only using an unbiased methodology and our articles are not intended to be financial advice. It does not constitute a recommendation to buy or sell any stock, and does not take account of your objectives, or your financial situation. We aim to bring you long-term focused analysis driven by fundamental data. Note that our analysis may not factor in the latest price-sensitive company announcements or qualitative material. Simply Wall St has no position in any stocks mentioned.
對本文有任何反饋?對內容有任何疑慮?請直接與我們聯繫。或者,發送電子郵件至editorial-team@simplywallst.com。
這篇文章是Simply Wall St的一般性文章。我們根據歷史數據和分析師預測提供評論,只使用公正的方法論,我們的文章並不意味着提供任何金融建議。文章不構成買賣任何股票的建議,也不考慮您的目標或您的財務狀況。我們的目標是帶給您基本數據驅動的長期關注分析。請注意,我們的分析可能不考慮最新的價格敏感公司公告或定性材料。Simply Wall St沒有任何股票頭寸。
Have feedback on this article? Concerned about the content? Get in touch with us directly. Alternatively, email editorial-team@simplywallst.com
對本文有任何反饋?對內容有任何疑慮?請直接與我們聯繫。或者,發送電子郵件至editorial-team@simplywallst.com。
譯文內容由第三人軟體翻譯。