
Stock Of The Day: NVIDIA Has Another Bearish Engulfing Pattern
Stock Of The Day: NVIDIA Has Another Bearish Engulfing Pattern
The last time a "bearish engulfing pattern" formed on the chart of NVIDIA Corp (NASDAQ:NVDA) a large move lower followed. Now another one of these patterns has formed — and it may also mean a move lower is coming.
英偉達公司(NASDAQ:NVDA)的圖表上上一次形成“看淡吞沒模式”時就出現了大幅下跌。現在又出現了另一個這樣的模式,這可能也意味着下跌的行情即將到來。
Many technical analysts attempt to identify chart patterns without understanding the price action that creates them. That's why Nvidia is our trading team's Stock of the Day.
許多技術分析師試圖在不了解形成它們的價格行情的情況下識別出圖表模式。這就是爲什麼英偉達是我們交易團隊今日的股票之一。
The chart illustrates two important technical analysis lessons.
該圖表展示了兩個重要的技術面分析教訓。
Reversals in markets happen when the leadership changes from bulls to bears or bears to bulls. If the change is slow and gradual, a "rounded top" or "rounded bottom" pattern may appear on the chart. If the change takes place over a couple of sessions, it may form a "V top" or "inverted V bottom" pattern.
市場發生逆轉是在領先者由牛轉熊或由熊轉牛時發生的。如果變化是緩慢和漸進的,圖表上可能出現“圓頂”或“圓底”模式。如果變化在幾個交易日內發生,可能形成“V型頂部”或“倒V型底部”模式。
And when the change in leadership takes place in just one day, an "engulfing pattern" may appear.
當領先者在一天內進行交接時,可能會出現“吞沒模式”。
Bearish Pattern for Nvidia
英偉達的看淡模式
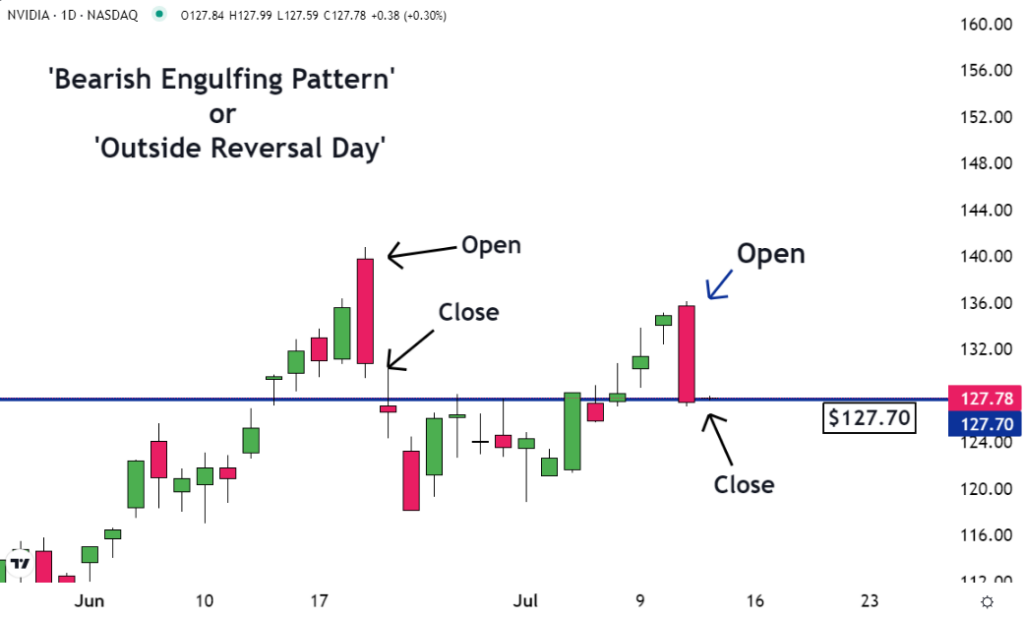
The important thing about this bearish engulfing pattern for Nvidia is the price action that caused it to form. In the morning it looked like it was going to be another up day. The opening price was higher than the previous day's close. It looked like the uptrend was going to continue.
這個關於英偉達的看淡吞沒模式的重要之處在於導致它出現的價格行情。早上看起來又要再次上漲。開盤價高於前一日收盤價。看來上升趨勢將會繼續。
But by the end of the day, something important happened. The sellers overpowered the buyers. They even pushed the price below the previous day's opening price.
但到了一天結束時,發生了一些重要的事情。賣方壓過了買方。他們甚至將價格壓低到了前一天的開盤價以下。
The open was higher than the previous close, and the close was lower than the previous open. The price action "engulfed" the prior day's action.
開盤價高於前一日收盤價,收盤價低於前一日開盤價。價格行情“吞沒”了前日的價格行情。
Most volume trades on the open and the close. Because of this there, is typically support at these levels. The fact that the stock fell right through them shows the sellers are extremely aggressive.
大多數成交量集中在開盤和收盤時段。因此,在這些水平上通常會有支撐位。股票穿過這些水平的事實表明賣方非常有攻擊性。
Support for Nvidia
英偉達的支撐位
There's another lesson on this chart.
這張圖表還有另一個教訓。
As you can see, after yesterday's sell-off, the shares closed just below $128.00. This isn't a coincidence. There is support here for Nvidia because these levels were previously resistance.
正如你所看到的,昨天股票下跌後,股價收於$128.00以下。這不是巧合。這裏對英偉達有支撐位,因爲這些水平之前曾經是阻力位。
Many traders who sold while the shares were at the resistance decided they made a mistake when the price moved higher. Some of them decided to buy their shares back if they could get them for the same price that they were sold for.
許多交易員在股票處於阻力位時出售,當價格上漲時,他們決定買回股票,以相同的價格將其賣出。
As a result, now that the price has fallen back to these levels, buy orders are placed. And if there are enough of these orders, it will create support at what had been resistance.
因此,現在,價格回落到這些水平,買單被下單。如果有足夠多的買單,它將在曾經的阻力位上形成支撐位。
To understand technical analysis, traders need to understand what chart patterns are. More importantly, they need to understand the price action that creates them.
要理解技術面分析,交易員需要了解圖表模式究竟是什麼。更重要的是,他們需要了解導致圖表形成的價格行情。
The image was created using artificial intelligence by MidJourney.
這張圖片是由MidJourney使用人工智能創建的。
譯文內容由第三人軟體翻譯。