
Rocket Lab Blasts Off With Golden Cross: Time To Buckle Up?
Rocket Lab Blasts Off With Golden Cross: Time To Buckle Up?
Rocket Lab USA, Inc. (NASDAQ:RKLB) is rocketing to new heights, catching the eyes of investors with its bullish technical signals. This space company, known for its launch services and space systems solutions, is now seeing its stock making a Golden Cross – a key indicator suggesting more bullish movement ahead.
Rocket Lab USA,Inc.(納斯達克:RKLB)正飛向新的高度,其看漲的技術信號吸引了投資者的目光。這家太空公司以其發射服務和空間系統解決方案聞名,現在看到其股票形成了金叉——一個關鍵指標,表明未來有更多的看漲行情。
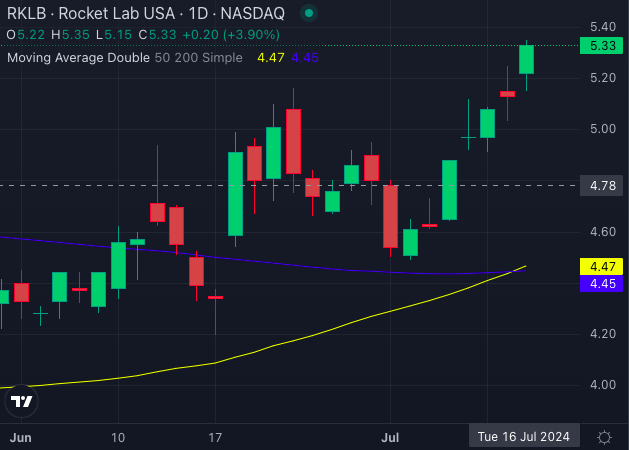
Chart created using Benzinga Pro
使用Benzinga Pro創建的圖表
Rocket Lab's share price currently sits at $5.33, comfortably above its 5, 20, and 50-day exponential moving averages. This trend is not just a blip; it's a sign of strong bullish momentum. The stock is experiencing buying pressure, a positive indicator for future gains.
Rocket Lab的股價目前位於5.33美元,遠高於其5、20和50天指數移動平均線。這個趨勢不只是暫時的,它是強勁看漲動能的信號。該股正在經歷買盤壓力,這是未來收益的積極指標。
Read Also: Elon Musk's SpaceX Fails To Deploy Starlink Satellites In Intended Orbit Owing To A Rocket Engine Issue, But Efforts Underway To Salvage Mission: 'Unlike A Star Trek Episode...'
讀者也可以閱讀:埃隆·馬斯克的SpaceX因火箭發動機問題未能將Starlink衛星部署到預期軌道上,但正在努力挽救任務:“不像星際迷航的一集...”
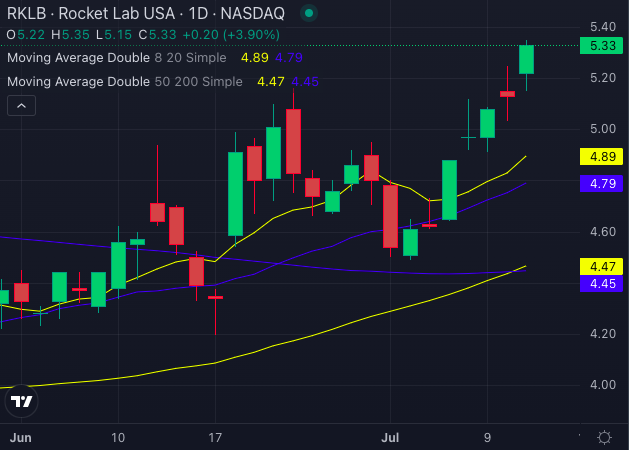
Chart created using Benzinga Pro
使用Benzinga Pro創建的圖表
Here's the breakdown of RKLB's stellar performance:
以下是RKLB出色表現的詳細信息:
- 8-day SMA: RKLB's share price at $5.33 vs. $4.89 – a clear bullish signal.
- 20-day SMA: Trading at $5.33 while the SMA stands at $4.79 – another bullish cue.
- 50-day SMA: RKLB at $5.33 compared to the 50-day SMA of $4.47 – yet another bullish indicator.
- 200-day SMA: Rocket Lab's price of $5.33 surpasses the 200-day SMA of $4.45 – a strong bullish signal.
- 8日簡單移動平均線(SMA):RKLB的股價爲5.33美元,而4.89美元則是明顯的看漲信號。
- 20日簡單移動平均線(SMA):交易價格爲5.33美元,而SMA爲4.79美元,又是另一個看漲信號。
- 50日簡單移動平均線(SMA):RKLb爲5.33美元,而50天SMA爲4.47美元,又是另一個看漲信號。
- 200日簡單移動平均線(SMA):Rocket Lab的價格爲5.33美元,超過了4.45美元的200天期平均線,是一個強勁的看漲信號。
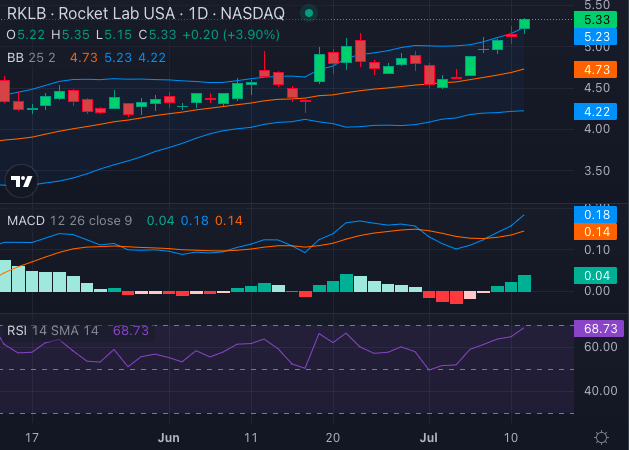
Chart created using Benzinga Pro
使用Benzinga Pro創建的圖表
The MACD indicator, standing at 0.18, further supports this bullish outlook. Meanwhile, Rocket Lab's RSI at 68.73 suggests the stock is overbought, adding to the buzz.
MACD指標爲0.18,進一步支持這種看漲的前景。同時,Rocket Lab的RSI爲68.73,表明該股票已經超買,加劇了市場熱度。
Bollinger Bands paint a similarly bullish picture:
布林帶也描繪了類似的看漲畫面:
- 25-Day Bands: The range is $4.22 – $5.23, with the stock price of $5.33 breaking above.
- 25天區間:範圍爲4.22美元至5.23美元,而股價5.33美元則突破了該區間。
Rocket Lab's innovative strides in spacecraft design, manufacturing, and its reusable orbital-class rockets are pushing it into the spotlight. With a clientele spanning commercial, aerospace prime contractors, and government customers, Rocket Lab is positioned to soar higher.
Rocket Lab在航天器設計、製造以及可重複使用的軌道級火箭方面的創新進展將其推向聚光燈下。橫跨商業、航空航天主要承包商和政府客戶的客戶群,Rocket Lab正準備飛得更高。
For those eyeing space stocks, Rocket Lab's Golden Cross might be the signal to buckle up for a potentially exciting ride.
對於那些關注太空股票的人來說,Rocket Lab的金叉或許是一個提示,必須爲未來可能帶來的興奮乘坐便車。
Is this a new dawn for Rocket Lab? Only time will tell, but the technicals are certainly pointing towards a bullish trajectory.
這是Rocket Lab的一個新時代嗎?時間會告訴我們,但是技術面顯然是指向看漲軌跡的。
- Rocket Lab Sets Launch Window For Next Space Mission
- Rocket Lab爲下一次太空任務設置了發射時間窗口
Photo: Shutterstock
Photo: shutterstock
譯文內容由第三人軟體翻譯。