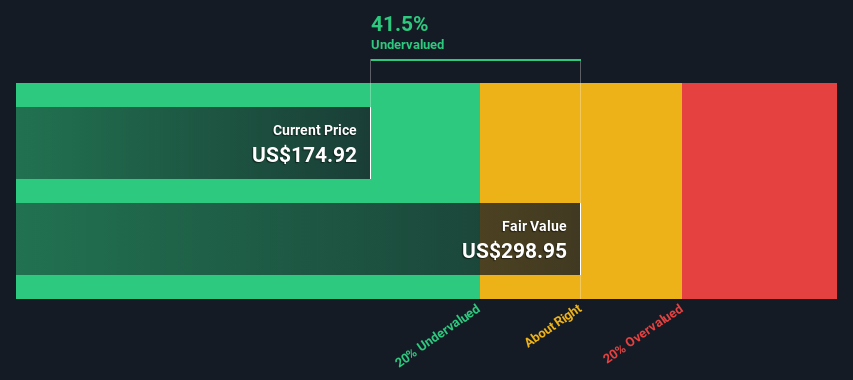
Cheniere Energy's estimated fair value is US$299 based on 2 Stage Free Cash Flow to Equity
Cheniere Energy is estimated to be 41% undervalued based on current share price of US$175
Analyst price target for LNG is US$199 which is 33% below our fair value estimate
Today we will run through one way of estimating the intrinsic value of Cheniere Energy, Inc. (NYSE:LNG) by taking the expected future cash flows and discounting them to their present value. Our analysis will employ the Discounted Cash Flow (DCF) model. Models like these may appear beyond the comprehension of a lay person, but they're fairly easy to follow.
Remember though, that there are many ways to estimate a company's value, and a DCF is just one method. If you still have some burning questions about this type of valuation, take a look at the Simply Wall St analysis model.
Is Cheniere Energy Fairly Valued?
We are going to use a two-stage DCF model, which, as the name states, takes into account two stages of growth. The first stage is generally a higher growth period which levels off heading towards the terminal value, captured in the second 'steady growth' period. To start off with, we need to estimate the next ten years of cash flows. Where possible we use analyst estimates, but when these aren't available we extrapolate the previous free cash flow (FCF) from the last estimate or reported value. We assume companies with shrinking free cash flow will slow their rate of shrinkage, and that companies with growing free cash flow will see their growth rate slow, over this period. We do this to reflect that growth tends to slow more in the early years than it does in later years.
Generally we assume that a dollar today is more valuable than a dollar in the future, so we discount the value of these future cash flows to their estimated value in today's dollars:
10-year free cash flow (FCF) estimate
2025
2026
2027
2028
2029
2030
2031
2032
2033
2034
Levered FCF ($, Millions)
US$2.89b
US$3.85b
US$4.12b
US$4.62b
US$5.00b
US$5.33b
US$5.60b
US$5.85b
US$6.07b
US$6.27b
Growth Rate Estimate Source
Analyst x5
Analyst x4
Analyst x2
Analyst x1
Est @ 8.20%
Est @ 6.45%
Est @ 5.23%
Est @ 4.38%
Est @ 3.78%
Est @ 3.36%
Present Value ($, Millions) Discounted @ 9.3%
US$2.6k
US$3.2k
US$3.2k
US$3.2k
US$3.2k
US$3.1k
US$3.0k
US$2.9k
US$2.7k
US$2.6k
("Est" = FCF growth rate estimated by Simply Wall St) Present Value of 10-year Cash Flow (PVCF) = US$30b
After calculating the present value of future cash flows in the initial 10-year period, we need to calculate the Terminal Value, which accounts for all future cash flows beyond the first stage. For a number of reasons a very conservative growth rate is used that cannot exceed that of a country's GDP growth. In this case we have used the 5-year average of the 10-year government bond yield (2.4%) to estimate future growth. In the same way as with the 10-year 'growth' period, we discount future cash flows to today's value, using a cost of equity of 9.3%.
Present Value of Terminal Value (PVTV)= TV / (1 + r)10= US$93b÷ ( 1 + 9.3%)10= US$39b
The total value, or equity value, is then the sum of the present value of the future cash flows, which in this case is US$68b. In the final step we divide the equity value by the number of shares outstanding. Relative to the current share price of US$175, the company appears quite good value at a 41% discount to where the stock price trades currently. The assumptions in any calculation have a big impact on the valuation, so it is better to view this as a rough estimate, not precise down to the last cent.
NYSE:LNG Discounted Cash Flow July 11th 2024
Important Assumptions
Now the most important inputs to a discounted cash flow are the discount rate, and of course, the actual cash flows. If you don't agree with these result, have a go at the calculation yourself and play with the assumptions. The DCF also does not consider the possible cyclicality of an industry, or a company's future capital requirements, so it does not give a full picture of a company's potential performance. Given that we are looking at Cheniere Energy as potential shareholders, the cost of equity is used as the discount rate, rather than the cost of capital (or weighted average cost of capital, WACC) which accounts for debt. In this calculation we've used 9.3%, which is based on a levered beta of 1.494. Beta is a measure of a stock's volatility, compared to the market as a whole. We get our beta from the industry average beta of globally comparable companies, with an imposed limit between 0.8 and 2.0, which is a reasonable range for a stable business.
SWOT Analysis for Cheniere Energy
Strength
Debt is well covered by earnings and cashflows.
Dividends are covered by earnings and cash flows.
Dividend information for LNG.
Weakness
Earnings declined over the past year.
Dividend is low compared to the top 25% of dividend payers in the Oil and Gas market.
Opportunity
Annual revenue is forecast to grow faster than the American market.
Good value based on P/E ratio and estimated fair value.
Threat
Annual earnings are forecast to decline for the next 3 years.
What else are analysts forecasting for LNG?
Moving On:
Although the valuation of a company is important, it is only one of many factors that you need to assess for a company. It's not possible to obtain a foolproof valuation with a DCF model. Preferably you'd apply different cases and assumptions and see how they would impact the company's valuation. For instance, if the terminal value growth rate is adjusted slightly, it can dramatically alter the overall result. Why is the intrinsic value higher than the current share price? For Cheniere Energy, we've put together three further aspects you should consider:
Risks: Case in point, we've spotted 2 warning signs for Cheniere Energy you should be aware of, and 1 of them is significant.
Future Earnings: How does LNG's growth rate compare to its peers and the wider market? Dig deeper into the analyst consensus number for the upcoming years by interacting with our free analyst growth expectation chart.
Other Solid Businesses: Low debt, high returns on equity and good past performance are fundamental to a strong business. Why not explore our interactive list of stocks with solid business fundamentals to see if there are other companies you may not have considered!
PS. Simply Wall St updates its DCF calculation for every American stock every day, so if you want to find the intrinsic value of any other stock just search here.
Have feedback on this article? Concerned about the content?Get in touch with us directly. Alternatively, email editorial-team (at) simplywallst.com. This article by Simply Wall St is general in nature. We provide commentary based on historical data and analyst forecasts only using an unbiased methodology and our articles are not intended to be financial advice. It does not constitute a recommendation to buy or sell any stock, and does not take account of your objectives, or your financial situation. We aim to bring you long-term focused analysis driven by fundamental data. Note that our analysis may not factor in the latest price-sensitive company announcements or qualitative material. Simply Wall St has no position in any stocks mentioned.
Have feedback on this article? Concerned about the content? Get in touch with us directly. Alternatively, email editorial-team@simplywallst.com
主要見解
根據兩階段自由現金流估算法,Cheniere Energy 的估價爲299美元。
根據目前175美元的股價,Cheniere Energy 估價低估了41%。
LNG 的分析師目標價爲199美元,比我們的估價低33%。
今天我們將通過將預期未來現金流折現爲現值來估算 Cheniere Energy Inc (NYSE:LNG) 的內在價值。我們的分析將使用貼現現金流模型(DCF)。像這樣的模型可能超出一個普通人的理解,但它們是相當容易理解的。
折現現金流最重要的輸入是折現率和實際現金流。如果您不同意這些結果,請嘗試自己進行計算並玩弄假設。DCF模型還未考慮行業可能的週期性或公司未來的資本需求,因此它不能完全展示公司的潛在表現。鑑於我們正在考慮成爲 Cheniere Energy 的潛在股東,我們將股權成本用作折現率,而不是考慮到債務的資本成本(或加權平均資本成本,WACC)。在此計算中,我們使用了9.3%,這是基於1.494的市場槓桿貝塔值。貝塔是股票相對於整個市場的波動性度量。我們從全球可比公司的行業平均貝塔中獲得貝塔,將其設定在0.8至2.0之間,這是一個穩定企業合理的範圍。