
Is Hub Group (NASDAQ:HUBG) A Risky Investment?
Is Hub Group (NASDAQ:HUBG) A Risky Investment?
Some say volatility, rather than debt, is the best way to think about risk as an investor, but Warren Buffett famously said that 'Volatility is far from synonymous with risk.' It's only natural to consider a company's balance sheet when you examine how risky it is, since debt is often involved when a business collapses. We can see that Hub Group, Inc. (NASDAQ:HUBG) does use debt in its business. But is this debt a concern to shareholders?
作爲投資者,有些人認爲波動性而不是債務是思考風險的最佳方式,但禾倫·巴菲特曾經說過:“波動性遠非風險的同義詞。” 當你考慮一個公司的風險時,自然而然會考慮它的資產負債表,因爲債務通常會在公司崩潰時是涉及的。我們可以看到Hub Group, Inc. (NASDAQ:HUBG)在業務中確實會使用債務。但是,這種債務會讓股東感到擔憂嗎?
Why Does Debt Bring Risk?
爲什麼債務會帶來風險?
Debt is a tool to help businesses grow, but if a business is incapable of paying off its lenders, then it exists at their mercy. In the worst case scenario, a company can go bankrupt if it cannot pay its creditors. However, a more frequent (but still costly) occurrence is where a company must issue shares at bargain-basement prices, permanently diluting shareholders, just to shore up its balance sheet. Having said that, the most common situation is where a company manages its debt reasonably well - and to its own advantage. When we examine debt levels, we first consider both cash and debt levels, together.
債務是幫助企業發展的工具,但如果一家企業無法償還其債權人的債務,則將會處於其垂詢之下。最糟糕的情況下,如果一家公司無法償還其債權人,則可能破產。然而,更頻繁(但仍然代價高昂)的情況是,一家公司必須以非常低的價格發行股份,永久性地稀釋股東,以支持其資產負債表。但是,常見的情況是,一家公司合理地管理其債務,並將其用於自己的利益。當我們審查債務水平時,首先要考慮現金和債務水平。
How Much Debt Does Hub Group Carry?
Hub Group承擔了多少債務?
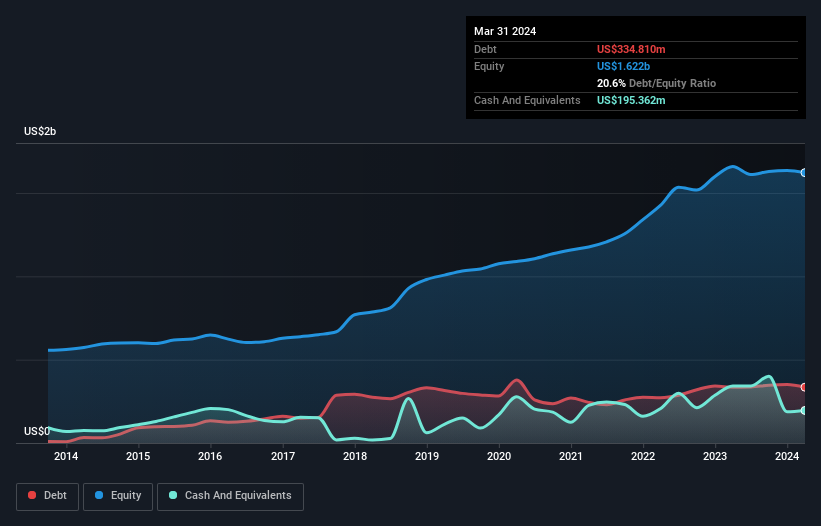
The chart below, which you can click on for greater detail, shows that Hub Group had US$334.8m in debt in March 2024; about the same as the year before. However, it also had US$195.4m in cash, and so its net debt is US$139.4m.
下面的圖表顯示,Hub Group在2024年3月的債務金額爲33480萬美元,與去年大致相同。然而,它也擁有19540萬美元的現金,因此其淨債務爲13940萬美元。
How Healthy Is Hub Group's Balance Sheet?
Hub Group的資產負債表狀況如何?
The latest balance sheet data shows that Hub Group had liabilities of US$648.6m due within a year, and liabilities of US$620.5m falling due after that. Offsetting this, it had US$195.4m in cash and US$593.9m in receivables that were due within 12 months. So its liabilities outweigh the sum of its cash and (near-term) receivables by US$479.8m.
最新的資產負債表數據顯示,Hub Group有64860萬美元的1年內到期負債和62050萬美元的到期負債。與此相抵,它有19540萬美元的現金和59390萬美元的應收賬款,這些應收賬款在12個月內到期。因此,其負債超過其現金和(短期)應收賬款的總和47980萬美元。
Given Hub Group has a market capitalization of US$2.57b, it's hard to believe these liabilities pose much threat. Having said that, it's clear that we should continue to monitor its balance sheet, lest it change for the worse.
考慮到Hub Group的市值爲2.57億美元,很難相信這些負債會構成很大的威脅。話雖如此,很明顯我們應該繼續監測其資產負債表,以防發生不利的變化。
In order to size up a company's debt relative to its earnings, we calculate its net debt divided by its earnings before interest, tax, depreciation, and amortization (EBITDA) and its earnings before interest and tax (EBIT) divided by its interest expense (its interest cover). This way, we consider both the absolute quantum of the debt, as well as the interest rates paid on it.
爲了衡量公司債務相對於其收益的大小,我們計算其淨債務除以利息、稅、折舊和攤銷前收益(EBITDA)以及其稅前收益與利息支出(其利息覆蓋率)的比率。這樣,我們既考慮了債務的絕對量,也考慮了所支付的利率。
Hub Group's net debt is only 0.39 times its EBITDA. And its EBIT easily covers its interest expense, being 39.2 times the size. So we're pretty relaxed about its super-conservative use of debt. The modesty of its debt load may become crucial for Hub Group if management cannot prevent a repeat of the 60% cut to EBIT over the last year. When it comes to paying off debt, falling earnings are no more useful than sugary sodas are for your health. There's no doubt that we learn most about debt from the balance sheet. But ultimately the future profitability of the business will decide if Hub Group can strengthen its balance sheet over time. So if you're focused on the future you can check out this free report showing analyst profit forecasts.
Hub Group的淨債務僅爲其EBITDA的0.39倍。而且它的EBIT輕鬆覆蓋了利息支出,39.2倍於其利息支出。因此,我們對它極度保守地使用債務感到非常放心。如果管理層無法阻止過去一年EBIT下降60%的重蹈覆轍,那麼它債務負擔的適度程度可能會變得非常關鍵。在償還債務方面,下降的收益對你的健康並沒有任何用處。毫無疑問,我們從資產負債表上了解債務情況。但最終,業務的未來盈利能力將決定Hub Group能否隨着時間的推移鞏固其資產負債表。因此,如果您關注未來,可以查看這份免費報告,其中顯示了分析師的利潤預測。
Finally, a business needs free cash flow to pay off debt; accounting profits just don't cut it. So we always check how much of that EBIT is translated into free cash flow. During the last three years, Hub Group produced sturdy free cash flow equating to 64% of its EBIT, about what we'd expect. This free cash flow puts the company in a good position to pay down debt, when appropriate.
最後,公司需要自由現金流來償還債務;會計利潤並不能解決問題。因此,我們始終會檢查其中多少金額可以轉化爲自由現金流。在過去的三年中,Hub Group產生了強有力的自由現金流,相當於其EBIT的64%,與我們的預期相當。這種自由現金流使該公司在適當時可以處於良好的償還債務地位。
Our View
我們的觀點
Hub Group's EBIT growth rate was a real negative on this analysis, although the other factors we considered were considerably better. In particular, we are dazzled with its interest cover. Considering this range of data points, we think Hub Group is in a good position to manage its debt levels. But a word of caution: we think debt levels are high enough to justify ongoing monitoring. The balance sheet is clearly the area to focus on when you are analysing debt. But ultimately, every company can contain risks that exist outside of the balance sheet. These risks can be hard to spot. Every company has them, and we've spotted 1 warning sign for Hub Group you should know about.
Hub Group的EBIT增長率對此分析而言是一個真正的負面因素,雖然我們考慮的其他因素要好得多。特別是,我們對其利息覆蓋率印象深刻。考慮到這些數據點,我們認爲Hub Group處於處理其債務水平的良好位置。但是要注意:我們認爲債務水平已經高到有必要進行持續監測的程度。當你分析債務時,資產負債表顯然是需要關注的。但最終,每家公司都可能存在超出資產負債表範圍的風險。恕我多言,但我們已經注意到了1個Hub Group的風險因素,你需要知道。
If, after all that, you're more interested in a fast growing company with a rock-solid balance sheet, then check out our list of net cash growth stocks without delay.
如果您在所有這些工作之後,更感興趣於擁有堅實資產負債表的快速發展公司,請立即查看我們的淨現金成長股列表。
Have feedback on this article? Concerned about the content? Get in touch with us directly. Alternatively, email editorial-team (at) simplywallst.com.
This article by Simply Wall St is general in nature. We provide commentary based on historical data and analyst forecasts only using an unbiased methodology and our articles are not intended to be financial advice. It does not constitute a recommendation to buy or sell any stock, and does not take account of your objectives, or your financial situation. We aim to bring you long-term focused analysis driven by fundamental data. Note that our analysis may not factor in the latest price-sensitive company announcements or qualitative material. Simply Wall St has no position in any stocks mentioned.
對本文有反饋?關注內容?請直接與我們聯繫。或者,發送電子郵件至editorial-team@simplywallst.com。
這篇文章是Simply Wall St的一般性文章。我們根據歷史數據和分析師預測提供評論,只使用公正的方法論,我們的文章並不意味着提供任何金融建議。文章不構成買賣任何股票的建議,也不考慮您的目標或您的財務狀況。我們的目標是帶給您基本數據驅動的長期關注分析。請注意,我們的分析可能不考慮最新的價格敏感公司公告或定性材料。Simply Wall St沒有任何股票頭寸。
Have feedback on this article? Concerned about the content? Get in touch with us directly. Alternatively, email editorial-team@simplywallst.com
對本文有反饋? 對內容感到擔憂? 請直接與我們聯繫。 或者,發送電子郵件至editorial-team@simplywallst.com。
譯文內容由第三人軟體翻譯。