
Shareholders in National Vision Holdings (NASDAQ:EYE) Have Lost 76%, as Stock Drops 6.3% This Past Week
Shareholders in National Vision Holdings (NASDAQ:EYE) Have Lost 76%, as Stock Drops 6.3% This Past Week
Every investor on earth makes bad calls sometimes. But you have a problem if you face massive losses more than once in a while. So spare a thought for the long term shareholders of National Vision Holdings, Inc. (NASDAQ:EYE); the share price is down a whopping 76% in the last three years. That would be a disturbing experience. The more recent news is of little comfort, with the share price down 51% in a year. Shareholders have had an even rougher run lately, with the share price down 40% in the last 90 days.
地球上的每個投資者都會犯錯。但是,如果你經常面對巨大的損失,那麼你就有問題了。那麼,請爲National Vision Holdings,Inc. (納斯達克:EYE)的長期股東考慮一下;股票價格在過去三年中暴跌了76%。這將是一個令人不安的經歷。最近的消息也沒有什麼安慰,股價在一年內下跌了51%。股東們最近的境遇更加艱難,股價在過去90天中下跌了40%。
If the past week is anything to go by, investor sentiment for National Vision Holdings isn't positive, so let's see if there's a mismatch between fundamentals and the share price.
如果過去一週是任何參考,那麼National Vision Holdings的投資者情緒並不樂觀,因此讓我們看看基本面和股票價格之間是否存在不匹配。
While the efficient markets hypothesis continues to be taught by some, it has been proven that markets are over-reactive dynamic systems, and investors are not always rational. One way to examine how market sentiment has changed over time is to look at the interaction between a company's share price and its earnings per share (EPS).
雖然有效市場假說仍然被一些人教授,但被證明市場是過度反應的動態系統,投資者並不總是理性的。檢查市場情緒如何隨時間變化的一種方法是看一個公司的股價與其每股收益(EPS)之間的交互作用。
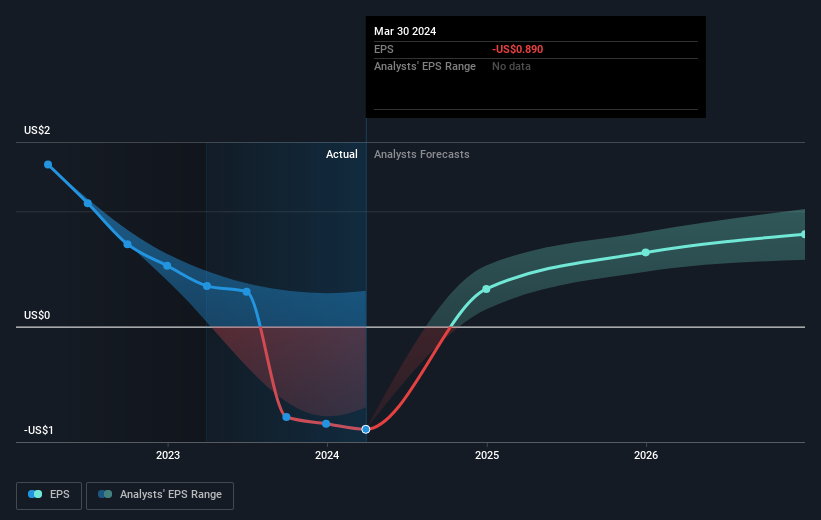
National Vision Holdings saw its share price decline over the three years in which its EPS also dropped, falling to a loss. Extraordinary items contributed to this situation. Due to the loss, it's not easy to use EPS as a reliable guide to the business. But it's safe to say we'd generally expect the share price to be lower as a result!
在National Vision Holdings的EPS下降,陷入虧損的三年裏,其股價也下跌了。特殊項目導致了這種情況。由於虧損,很難將EPS作爲業務的可靠指南。但可以說,我們通常希望股票價格會因此而降低!
You can see how EPS has changed over time in the image below (click on the chart to see the exact values).
您可以在下面的圖片中查看每股收益如何隨時間變化(單擊圖表以查看確切的價值)。
It's good to see that there was some significant insider buying in the last three months. That's a positive. That said, we think earnings and revenue growth trends are even more important factors to consider. Before buying or selling a stock, we always recommend a close examination of historic growth trends, available here..
很高興看到在過去三個月中有一些重要的內部買入,這是積極的。話雖如此,我們認爲考慮收益和營收增長趨勢更爲重要。在買賣股票之前,我們始終建議對歷史增長趨勢進行仔細的考慮。這裏可以提供相關數據。
A Different Perspective
不同的觀點
Investors in National Vision Holdings had a tough year, with a total loss of 51%, against a market gain of about 26%. Even the share prices of good stocks drop sometimes, but we want to see improvements in the fundamental metrics of a business, before getting too interested. Unfortunately, last year's performance may indicate unresolved challenges, given that it was worse than the annualised loss of 10% over the last half decade. Generally speaking long term share price weakness can be a bad sign, though contrarian investors might want to research the stock in hope of a turnaround. If you want to research this stock further, the data on insider buying is an obvious place to start. You can click here to see who has been buying shares - and the price they paid.
National Vision Holdings的投資者度過了艱難的一年,全年虧損51%,而市場增長約爲26%。即使好股票的股價有時會下跌,但我們希望在對一個企業的基本指標有所改善之前,才會對其產生濃厚興趣。不幸的是,去年的表現可能表明存在尚未解決的挑戰,因爲比過去半個世紀的年化虧損10%還要糟糕。一般來說,長期股價疲軟可能是一個不好的跡象,儘管違背常規的投資者可能會在希望企業扭轉局面時對股票進行研究。如果您想更深入地研究此股票,內部買入數據是一個顯而易見的起點。您可以單擊此處查看誰購買了股票以及他們支付的價格。
If you like to buy stocks alongside management, then you might just love this free list of companies. (Hint: most of them are flying under the radar).
如果您喜歡與管理層共同購買股票,那麼您可能會喜歡這個免費的公司列表(提示:大多數公司沒有受到關注)。
Please note, the market returns quoted in this article reflect the market weighted average returns of stocks that currently trade on American exchanges.
請注意,本文所引述的市場回報反映了目前在美國交易所上市的股票的市場加權平均回報。
Have feedback on this article? Concerned about the content? Get in touch with us directly. Alternatively, email editorial-team (at) simplywallst.com.
This article by Simply Wall St is general in nature. We provide commentary based on historical data and analyst forecasts only using an unbiased methodology and our articles are not intended to be financial advice. It does not constitute a recommendation to buy or sell any stock, and does not take account of your objectives, or your financial situation. We aim to bring you long-term focused analysis driven by fundamental data. Note that our analysis may not factor in the latest price-sensitive company announcements or qualitative material. Simply Wall St has no position in any stocks mentioned.
對本文有反饋?關於內容有所顧慮?直接和我們聯繫。或者,發送電子郵件至editorial-team (at) simplywallst.com。
這篇文章是Simply Wall St的一般性文章。我們根據歷史數據和分析師預測提供評論,只使用公正的方法論,我們的文章並不意味着提供任何金融建議。文章不構成買賣任何股票的建議,也不考慮您的目標或您的財務狀況。我們的目標是帶給您基本數據驅動的長期關注分析。請注意,我們的分析可能不考慮最新的價格敏感公司公告或定性材料。Simply Wall St沒有任何股票頭寸。
Have feedback on this article? Concerned about the content? Get in touch with us directly. Alternatively, email editorial-team@simplywallst.com
對本文有反饋?關於內容有所顧慮?直接和我們聯繫。或者發送電子郵件至editorial-team@simplywallst.com。
譯文內容由第三人軟體翻譯。