
Further Weakness as Repay Holdings (NASDAQ:RPAY) Drops 8.9% This Week, Taking Three-year Losses to 61%
Further Weakness as Repay Holdings (NASDAQ:RPAY) Drops 8.9% This Week, Taking Three-year Losses to 61%
The truth is that if you invest for long enough, you're going to end up with some losing stocks. But the long term shareholders of Repay Holdings Corporation (NASDAQ:RPAY) have had an unfortunate run in the last three years. Sadly for them, the share price is down 61% in that time. The last week also saw the share price slip down another 8.9%.
事實上,如果你投資時間足夠長,你總會擁有一些輸錢的股票。但是Repay Holdings Corporation(NASDAQ:RPAY)的長期股東在過去的三年裏運氣不佳。可悲的是,股價在此期間下跌了61%。上週,股價下跌了8.9%。
If the past week is anything to go by, investor sentiment for Repay Holdings isn't positive, so let's see if there's a mismatch between fundamentals and the share price.
如果過去一週有什麼作爲Repaly Holdings股票投資者的參考,那麼我們來看看基本面和股價之間是否存在誤差。
Because Repay Holdings made a loss in the last twelve months, we think the market is probably more focussed on revenue and revenue growth, at least for now. Generally speaking, companies without profits are expected to grow revenue every year, and at a good clip. That's because fast revenue growth can be easily extrapolated to forecast profits, often of considerable size.
由於Repay Holdings在過去的12個月中虧損,我們認爲市場目前可能更關注收入和收入增長。一般來說,預期每年增長收入的公司都沒有盈利,而且增長速度很快。這是因爲快速增長的收入很容易推算出可觀的盈利。
In the last three years, Repay Holdings saw its revenue grow by 19% per year, compound. That's a pretty good rate of top-line growth. That contrasts with the weak share price, which has fallen 17% compounded, over three years. The market must have had really high expectations to be disappointed with this progress. It would be well worth taking a closer look at the company, to determine growth trends (and balance sheet strength).
在過去的三年中,Repay Holdings的營業收入每年複合增長率爲19%。這是一種相當不錯的營業收入增長率。與此形成鮮明對比的是,股價在這三年裏以17%的複合下跌。市場一定對這一進展抱有極高的期望才會如此失望。如果我們仔細觀察該公司的成長趨勢(以及資產負債表的強度),這將是非常值得的。
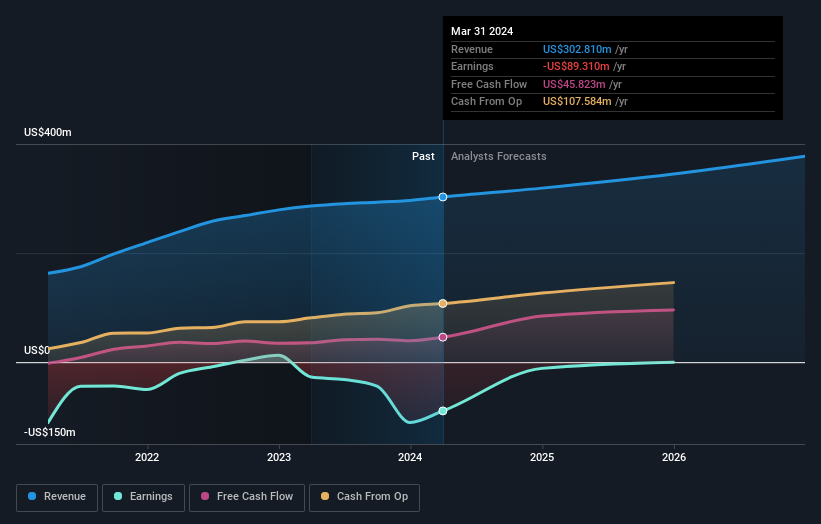
You can see below how earnings and revenue have changed over time (discover the exact values by clicking on the image).
您可以看到以下收益和營收的變化情況(通過單擊圖像了解精確值)。
This free interactive report on Repay Holdings' balance sheet strength is a great place to start, if you want to investigate the stock further.
如果您想進一步調查該股票,Repay Holdings的這份免費交互式報告對於評估財務狀況是非常好的起點。
A Different Perspective
不同的觀點
Repay Holdings' TSR for the year was broadly in line with the market average, at 25%. To take a positive view, the gain is pleasing, and it sure beats annualized TSR loss of 5%, which was endured over half a decade. While 'turnarounds seldom turn' there are green shoots for Repay Holdings. I find it very interesting to look at share price over the long term as a proxy for business performance. But to truly gain insight, we need to consider other information, too. Case in point: We've spotted 1 warning sign for Repay Holdings you should be aware of.
Repay Holdings在今年的TSR與市場平均水平基本持平,爲25%。持樂觀態度,這一收益令人滿意,而且肯定比在過去五年中每年化的TSR虧損5%好。雖然“轉型很難成功”,但Repay Holdings確實有一些綠色新芽。我認爲,長期的股價作爲業務表現的代理是非常有趣的。但是,爲了真正獲得洞見,我們還需要考慮其他信息。例如:我們注意到有1個針對Repay Holdings的警告信號,您應該謹慎對待。
If you would prefer to check out another company -- one with potentially superior financials -- then do not miss this free list of companies that have proven they can grow earnings.
如果您願意查看另一家公司-具有潛在更優質財務狀況的公司-則不要錯過這個免費的公司列表,這些公司已經證明他們可以增長收益。
Please note, the market returns quoted in this article reflect the market weighted average returns of stocks that currently trade on American exchanges.
請注意,本文所引述的市場回報反映了目前在美國交易所上市的股票的市場加權平均回報。
Have feedback on this article? Concerned about the content? Get in touch with us directly. Alternatively, email editorial-team (at) simplywallst.com.
This article by Simply Wall St is general in nature. We provide commentary based on historical data and analyst forecasts only using an unbiased methodology and our articles are not intended to be financial advice. It does not constitute a recommendation to buy or sell any stock, and does not take account of your objectives, or your financial situation. We aim to bring you long-term focused analysis driven by fundamental data. Note that our analysis may not factor in the latest price-sensitive company announcements or qualitative material. Simply Wall St has no position in any stocks mentioned.
對本文有反饋?關於內容有所顧慮?直接和我們聯繫。或者,發送電子郵件至editorial-team (at) simplywallst.com。
這篇文章是Simply Wall St的一般性文章。我們根據歷史數據和分析師預測提供評論,只使用公正的方法論,我們的文章並不意味着提供任何金融建議。文章不構成買賣任何股票的建議,也不考慮您的目標或您的財務狀況。我們的目標是帶給您基本數據驅動的長期關注分析。請注意,我們的分析可能不考慮最新的價格敏感公司公告或定性材料。Simply Wall St沒有任何股票頭寸。
Have feedback on this article? Concerned about the content? Get in touch with us directly. Alternatively, email editorial-team@simplywallst.com
對本文有反饋?關於內容有所顧慮?直接和我們聯繫。或者發送電子郵件至editorial-team@simplywallst.com。
譯文內容由第三人軟體翻譯。