
Driven Brands Holdings (NASDAQ:DRVN) Hasn't Managed To Accelerate Its Returns
Driven Brands Holdings (NASDAQ:DRVN) Hasn't Managed To Accelerate Its Returns
What trends should we look for it we want to identify stocks that can multiply in value over the long term? Ideally, a business will show two trends; firstly a growing return on capital employed (ROCE) and secondly, an increasing amount of capital employed. Ultimately, this demonstrates that it's a business that is reinvesting profits at increasing rates of return. In light of that, when we looked at Driven Brands Holdings (NASDAQ:DRVN) and its ROCE trend, we weren't exactly thrilled.
我們應該尋找哪些趨勢?我們想確定可以長期價值成倍增長的股票?理想情況下,企業將表現出兩種趨勢;首先是增長 返回 論資本使用率(ROCE),其次是增加 金額 所用資本的比例。歸根結底,這表明這是一家以更高的回報率對利潤進行再投資的企業。有鑑於此,當我們研究Driven Brands Holdings(納斯達克股票代碼:DRVN)及其投資回報率趨勢時,我們並不感到非常興奮。
What Is Return On Capital Employed (ROCE)?
什麼是資本使用回報率(ROCE)?
For those that aren't sure what ROCE is, it measures the amount of pre-tax profits a company can generate from the capital employed in its business. Analysts use this formula to calculate it for Driven Brands Holdings:
對於那些不確定ROCE是什麼的人,它衡量的是公司從其業務中使用的資本中可以產生的稅前利潤金額。分析師使用這個公式來計算 Driven Brands Holdings 的值:
Return on Capital Employed = Earnings Before Interest and Tax (EBIT) ÷ (Total Assets - Current Liabilities)
已動用資本回報率 = 息稅前收益 (EBIT) ¥(總資產-流動負債)
0.057 = US$311m ÷ (US$5.9b - US$439m) (Based on the trailing twelve months to March 2024).
0.057 = 3.11億美元 ÷(59億美元-4.39億美元) (基於截至2024年3月的過去十二個月)。
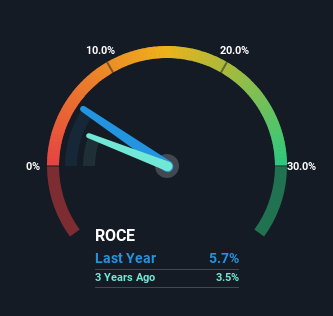
So, Driven Brands Holdings has an ROCE of 5.7%. In absolute terms, that's a low return and it also under-performs the Commercial Services industry average of 9.8%.
因此,Driven Brands Holdings的投資回報率爲5.7%。從絕對值來看,回報率很低,也低於商業服務行業9.8%的平均水平。
In the above chart we have measured Driven Brands Holdings' prior ROCE against its prior performance, but the future is arguably more important. If you'd like to see what analysts are forecasting going forward, you should check out our free analyst report for Driven Brands Holdings .
在上圖中,我們將Driven Brands Holdings之前的投資回報率與之前的表現進行了比較,但可以說,未來更爲重要。如果你想了解分析師對未來的預測,你應該查看我們爲Driven Brands Holdings提供的免費分析師報告。
What Does the ROCE Trend For Driven Brands Holdings Tell Us?
Driven Brands持股的ROCE趨勢告訴我們什麼?
There are better returns on capital out there than what we're seeing at Driven Brands Holdings. The company has consistently earned 5.7% for the last five years, and the capital employed within the business has risen 306% in that time. Given the company has increased the amount of capital employed, it appears the investments that have been made simply don't provide a high return on capital.
那裏的資本回報率比我們在Driven Brands Holdings看到的要好。在過去五年中,該公司的收入一直保持在5.7%,在此期間,公司內部使用的資本增長了306%。鑑於該公司增加了動用資本金額,看來已經進行的投資根本無法提供很高的資本回報率。
The Key Takeaway
關鍵要點
As we've seen above, Driven Brands Holdings' returns on capital haven't increased but it is reinvesting in the business. Since the stock has declined 54% over the last three years, investors may not be too optimistic on this trend improving either. On the whole, we aren't too inspired by the underlying trends and we think there may be better chances of finding a multi-bagger elsewhere.
正如我們在上面看到的那樣,Driven Brands Holdings的資本回報率沒有增加,但它正在對業務進行再投資。由於該股在過去三年中下跌了54%,因此投資者對這一趨勢的改善可能也不太樂觀。總的來說,我們對潛在趨勢的啓發不大,我們認爲在其他地方找到多袋裝機的可能性更大。
One more thing, we've spotted 1 warning sign facing Driven Brands Holdings that you might find interesting.
還有一件事,我們發現了Driven Brands Holdings面臨的一個警告標誌,你可能會覺得有趣。
If you want to search for solid companies with great earnings, check out this free list of companies with good balance sheets and impressive returns on equity.
如果你想尋找收益豐厚的穩健公司,可以免費查看這份資產負債表良好且股本回報率可觀的公司名單。
Have feedback on this article? Concerned about the content? Get in touch with us directly. Alternatively, email editorial-team (at) simplywallst.com.
This article by Simply Wall St is general in nature. We provide commentary based on historical data and analyst forecasts only using an unbiased methodology and our articles are not intended to be financial advice. It does not constitute a recommendation to buy or sell any stock, and does not take account of your objectives, or your financial situation. We aim to bring you long-term focused analysis driven by fundamental data. Note that our analysis may not factor in the latest price-sensitive company announcements or qualitative material. Simply Wall St has no position in any stocks mentioned.
對這篇文章有反饋嗎?對內容感到擔憂?直接聯繫我們。 或者,給編輯團隊 (at) simplywallst.com 發送電子郵件。
Simply Wall St的這篇文章本質上是籠統的。我們僅使用公正的方法根據歷史數據和分析師的預測提供評論,我們的文章無意作爲財務建議。它不構成買入或賣出任何股票的建議,也沒有考慮到您的目標或財務狀況。我們的目標是爲您提供由基本數據驅動的長期重點分析。請注意,我們的分析可能不考慮最新的價格敏感型公司公告或定性材料。簡而言之,華爾街沒有持有任何上述股票的頭寸。
Have feedback on this article? Concerned about the content? Get in touch with us directly. Alternatively, email editorial-team@simplywallst.com
對這篇文章有反饋嗎?對內容感到擔憂?直接聯繫我們。 或者,發送電子郵件至 editorial-team@simplywallst.com
譯文內容由第三人軟體翻譯。