
Stock Of The Day: General Motors Chart Reveals Seller's Remorse
Stock Of The Day: General Motors Chart Reveals Seller's Remorse
Successful traders know that some price levels are more important than others. They are called support and resistance levels. This is important because stocks tend to reverse when they reach them, and this is when trading profits can be made.
成功的交易者知道,價格水平的某些級別比其他級別更重要。它們被稱爲支撐位和壓力位。這很重要,因爲股票在達到這些級別時往往會逆轉,而這就是交易利潤可以實現的時候。
These levels form because of investor and trader psychology. Seller's remorse is a common dynamic, and it can be seen on the chart of General Motors Company (NYSE:GM). Our team of technical analysts have made it our Stock of the Day.
這些級別是由於投資者和交易員的心理所形成的。賣家的後悔是一種常見的動態,可以在通用汽車公司(NYSE:GM)的圖表上看到。我們的技術分析團隊已將其確定爲我們的今日股票。
As you can see on the chart, General Motors found support around the $42.50 level in mid-April. After this, the shares rallied.
正如你在圖表上所看到的,通用汽車在4月中旬在42.50美元左右發現了支撐。此後,股價反彈。
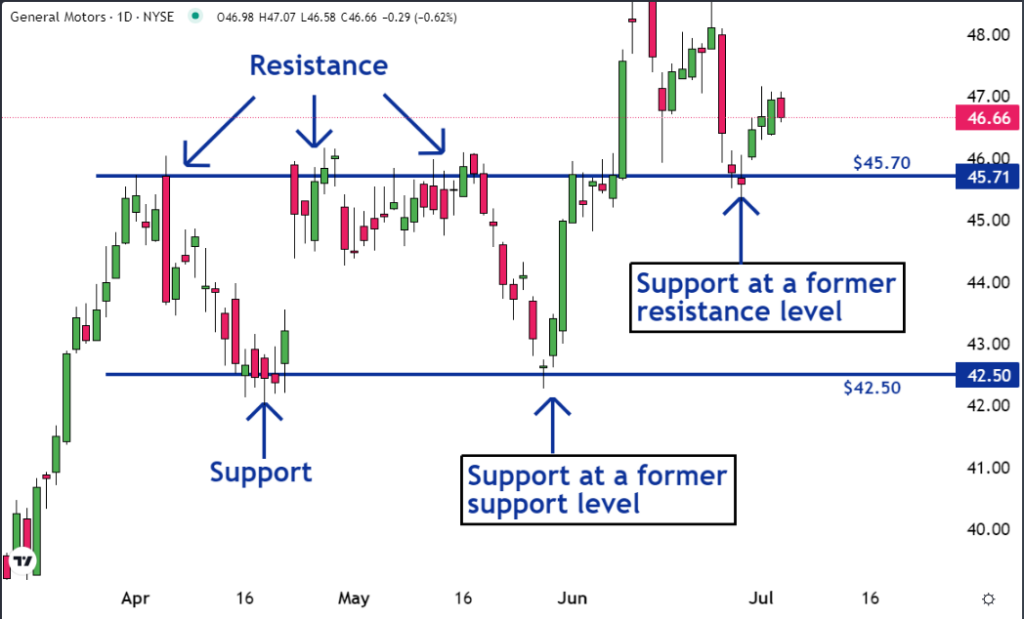
Then in late May another selloff occurred and once again the shares found support at $42.50. This wasn't a surprise because previous support levels often provide a safety net due to seller's remorse.
然後在五月底又發生了一次拋售,股票再次在42.50美元附近找到了支撐。這並不奇怪,因爲先前的支撐位通常由於賣家的後悔而提供安全保障。
In April, some investors sold their shares at the support level, only to see the price increase shortly afterward. These sellers, experiencing regret, often vow to repurchase their shares, but only at the price they initially sold them for.
四月份,一些投資者在支撐位賣出股票,結果很快就看到了價格上漲。這些賣家經歷了後悔回購,並經常發誓以最初出售時的價格重新購買股票。
As a result, they place buy orders at the price that had previously been support. If there is a sufficient quantity of these orders it will form support at the level once again.
因此,他們以先前的支撐價格下達買單。如果有足夠數量的這些訂單,它將再次形成該價位的支撐位。
Seller's remorse can also turn a resistance level into a support level. This can also be seen in the chart above.
賣家的後悔也可以將壓力位轉化爲支撐位。這在上圖中也可以看到。
The $45.70 level was resistance throughout April and May. When the stock moved higher in June, a number of the people who sold while the shares were at resistance came to believe they made a mistake.
45.70美元的級別在四月和五月都是壓力位。當股票在六月上漲時,很多在壓力位出售股票的人開始認爲他們犯了一個錯誤。
Many remorseful sellers decided to buy back their shares if they were able to get them at the same price they sold them for. As a result, when the shares fell back to what was previously the support level, these sellers placed buy orders, reinforcing the support at that price level.
許多後悔的賣家決定如果能以與賣出價格相同的價格購回股票。結果,當股票跌回之前的支撐水平時,這些賣家下了購買訂單,加強了該價格水平的支撐。
In cases where there are enough of these buy orders, a level that had been resistance can convert into support. As you can see on the chart, this is what happened here.
如果有足夠數量的這些買單,一個曾經是壓力位的級別就可以轉化爲支撐位。正如你在圖表上所看到的,這就是這裏發生的事情。
To understand technical analysis, charts need to be viewed through the prism of investor and trader psychology. Most traders overthink and end up losing money.
要理解技術分析,必須通過投資者和交易員的心理來看待圖表。大多數交易者過度思考,結果賠錢。
The best traders know which levels and trends are important. And they know how to profit from them.
最好的交易者知道哪些級別和趨勢是重要的。他們知道如何從中獲得利潤。
The General Motors chart is an excellent illustration of the importance of particular price levels.
通用汽車的圖表是特定價格水平的重要性的極好說明。
- Adobe, Oracle Named Top Tech Picks For July: Why This Investor Expects The AI Momentum To Continue
- adobe、甲骨文被評選爲七月份的首選科技股:爲什麼這位投資者認爲人工智能動能將繼續增長
Photo: Shutterstock
Photo: shutterstock
譯文內容由第三人軟體翻譯。