
Does APA (NASDAQ:APA) Have A Healthy Balance Sheet?
Does APA (NASDAQ:APA) Have A Healthy Balance Sheet?
The external fund manager backed by Berkshire Hathaway's Charlie Munger, Li Lu, makes no bones about it when he says 'The biggest investment risk is not the volatility of prices, but whether you will suffer a permanent loss of capital.' It's only natural to consider a company's balance sheet when you examine how risky it is, since debt is often involved when a business collapses. We can see that APA Corporation (NASDAQ:APA) does use debt in its business. But the real question is whether this debt is making the company risky.
伯克希爾哈撒韋旗下的外部基金管理人Charlie Munger支持的李錄在說“最大的投資風險不是價格的波動,而是您是否會遭受永久性的資本損失。”時一點也不含糊。當您考慮一個公司有多大的風險時,自然會考慮它的資產負債表,因爲在企業倒閉時通常會牽涉到債務。我們可以看到APA Corporation(納斯達克:APA)確實在業務中使用了債務。但真正的問題是這些債務是否使公司變得有風險。
Why Does Debt Bring Risk?
爲什麼債務會帶來風險?
Debt is a tool to help businesses grow, but if a business is incapable of paying off its lenders, then it exists at their mercy. If things get really bad, the lenders can take control of the business. However, a more frequent (but still costly) occurrence is where a company must issue shares at bargain-basement prices, permanently diluting shareholders, just to shore up its balance sheet. Of course, the upside of debt is that it often represents cheap capital, especially when it replaces dilution in a company with the ability to reinvest at high rates of return. When we think about a company's use of debt, we first look at cash and debt together.
債務是幫助企業增長的工具,但如果企業無法償還債權人,那麼它存在於債權人的掌控之中。如果情況變得非常糟糕,債權人可以接管企業。但是,更頻繁(但仍然昂貴)的情況是公司必須以驚人的低價發行股票,永久性地稀釋股東的權益,以支持其資產負債表。當然,債務的好處在於它通常代表廉價的資本,尤其是當它代替具有高回報率的公司再投資時。當我們考慮公司的債務使用時,我們首先看現金和債務的總和。
How Much Debt Does APA Carry?
APA負擔有多大的債務?
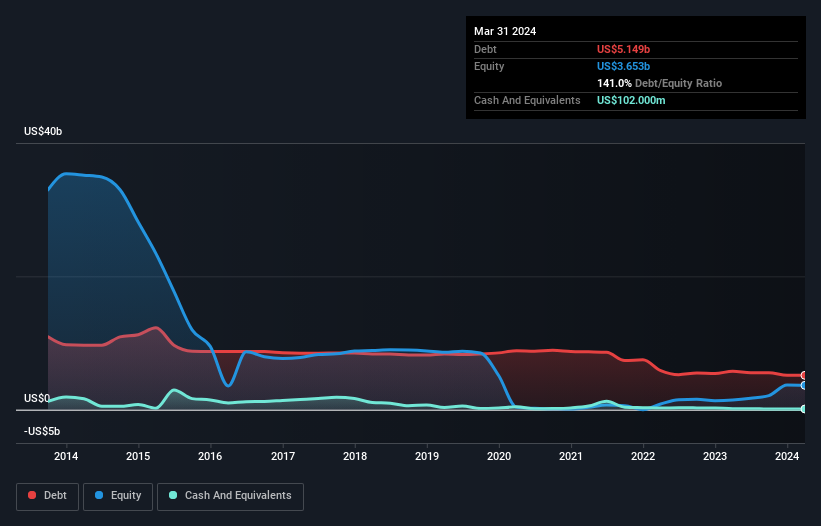
As you can see below, APA had US$5.15b of debt at March 2024, down from US$5.76b a year prior. Net debt is about the same, since the it doesn't have much cash.
正如下面所示,到2024年3月,APA的債務總額爲51.5億美元,較前一年的57.6億美元有所下降。淨債務基本相同,因爲它沒有太多現金。
How Strong Is APA's Balance Sheet?
APA的資產負債表有多強?
We can see from the most recent balance sheet that APA had liabilities of US$2.15b falling due within a year, and liabilities of US$9.15b due beyond that. Offsetting these obligations, it had cash of US$102.0m as well as receivables valued at US$1.60b due within 12 months. So it has liabilities totalling US$9.60b more than its cash and near-term receivables, combined.
我們可以看到,根據最近的資產負債表,APA的短期到期負債爲21.5億美元,而長期到期負債爲91.5億美元。抵消這些負債的是,它有1.02億美元的現金以及1.6億美元的應收賬款,在12個月內到期。因此,它的負債總額比現金和短期應收賬款還要高達96億美元。
This deficit is considerable relative to its very significant market capitalization of US$11.0b, so it does suggest shareholders should keep an eye on APA's use of debt. This suggests shareholders would be heavily diluted if the company needed to shore up its balance sheet in a hurry.
相對於其110億美元的極高市值,這個逆差還是相當大的,因此這表明股東們應該密切關注APA的債務使用情況。這表明,如果公司需要迅速扭轉資產負債表,股東們將會被削弱。
In order to size up a company's debt relative to its earnings, we calculate its net debt divided by its earnings before interest, tax, depreciation, and amortization (EBITDA) and its earnings before interest and tax (EBIT) divided by its interest expense (its interest cover). This way, we consider both the absolute quantum of the debt, as well as the interest rates paid on it.
爲了衡量公司債務相對於其收益的大小,我們計算其淨債務除以利息、稅、折舊和攤銷前收益(EBITDA)以及其稅前收益與利息支出(其利息覆蓋率)的比率。這樣,我們既考慮了債務的絕對量,也考慮了所支付的利率。
APA has net debt of just 1.0 times EBITDA, indicating that it is certainly not a reckless borrower. And it boasts interest cover of 10.0 times, which is more than adequate. But the bad news is that APA has seen its EBIT plunge 11% in the last twelve months. If that rate of decline in earnings continues, the company could find itself in a tight spot. When analysing debt levels, the balance sheet is the obvious place to start. But it is future earnings, more than anything, that will determine APA's ability to maintain a healthy balance sheet going forward. So if you want to see what the professionals think, you might find this free report on analyst profit forecasts to be interesting.
APA的淨債務只有1.0倍的EBITDA,表明它絕對不是一個魯莽的借款人。而且它的利息覆蓋率爲10.0倍,完全足夠。但不幸的是,APA在過去12個月中,其EBIT暴跌了11%。如果收益的下降速度繼續下去,公司可能會陷入困境。在分析債務水平時,資產負債表是顯而易見的起點。不過,未來的盈利,更多的是決定APA的資產負債表能否保持健康的關鍵因素。因此,如果您想知道專業人士對此的看法,您可能會發現分析師利潤預測的免費報告很有趣。
Finally, a business needs free cash flow to pay off debt; accounting profits just don't cut it. So it's worth checking how much of that EBIT is backed by free cash flow. During the last three years, APA produced sturdy free cash flow equating to 51% of its EBIT, about what we'd expect. This free cash flow puts the company in a good position to pay down debt, when appropriate.
最後,企業需要有自由現金流來償還債務;會計利潤並不能解決問題。因此,查看由多少EBIT支持的自由現金流是值得的。在過去的三年中,APA取得了相當可觀的自由現金流,相當於其EBIT的51%,這與我們的預期大致相同。這種自由現金流將使公司在適當時候有能力償還債務。
Our View
我們的觀點
While APA's EBIT growth rate does give us pause, its interest cover and net debt to EBITDA suggest it can stay on top of its debt load. Taking the abovementioned factors together we do think APA's debt poses some risks to the business. So while that leverage does boost returns on equity, we wouldn't really want to see it increase from here. There's no doubt that we learn most about debt from the balance sheet. However, not all investment risk resides within the balance sheet - far from it. Case in point: We've spotted 4 warning signs for APA you should be aware of, and 2 of them can't be ignored.
雖然APA的EBIT增長率讓我們有所顧慮,但其利息支付能力和淨債務EBITDA比也表明它能夠應對其債務負擔。綜合以上因素,我們認爲APA的債務對業務造成一定的風險。因此,雖然槓桿作用確實可以提高股本回報率,但我們並不希望看到它從目前的水平上升。毫無疑問,我們從資產負債表中了解到了大多數關於債務的信息。然而,並不是所有的投資風險都來自資產負債表-遠非如此。例如:我們發現APA存在4個警告信號,您應該意識到其中有2個是無法忽視的。
If, after all that, you're more interested in a fast growing company with a rock-solid balance sheet, then check out our list of net cash growth stocks without delay.
如果您在所有這些工作之後,更感興趣於擁有堅實資產負債表的快速發展公司,請立即查看我們的淨現金成長股列表。
Have feedback on this article? Concerned about the content? Get in touch with us directly. Alternatively, email editorial-team (at) simplywallst.com.
This article by Simply Wall St is general in nature. We provide commentary based on historical data and analyst forecasts only using an unbiased methodology and our articles are not intended to be financial advice. It does not constitute a recommendation to buy or sell any stock, and does not take account of your objectives, or your financial situation. We aim to bring you long-term focused analysis driven by fundamental data. Note that our analysis may not factor in the latest price-sensitive company announcements or qualitative material. Simply Wall St has no position in any stocks mentioned.
對本文有反饋?關於內容有所顧慮?直接和我們聯繫。或者,發送電子郵件至editorial-team (at) simplywallst.com。
這篇文章是Simply Wall St的一般性文章。我們根據歷史數據和分析師預測提供評論,只使用公正的方法論,我們的文章並不意味着提供任何金融建議。文章不構成買賣任何股票的建議,也不考慮您的目標或您的財務狀況。我們的目標是帶給您基本數據驅動的長期關注分析。請注意,我們的分析可能不考慮最新的價格敏感公司公告或定性材料。Simply Wall St沒有任何股票頭寸。
Have feedback on this article? Concerned about the content? Get in touch with us directly. Alternatively, email editorial-team@simplywallst.com
對本文有反饋?關於內容有所顧慮?直接和我們聯繫。或者發送電子郵件至editorial-team@simplywallst.com。
譯文內容由第三人軟體翻譯。