
AT&T Stock Hits 52-Week High: Bulls Charge Ahead
AT&T Stock Hits 52-Week High: Bulls Charge Ahead
AT&T Inc (NYSE:T) soared to a new 52-week high of $19.32 during day trading on July 1, showcasing a robust upward trajectory.
7月1日,AT&T股票(NYSE:T)日間交易一度飆升至新的52周高點19.32美元,展現出強勁的上升軌跡。
The stock has climbed an impressive 17.74% over the past year and is up 13.11% year-to-date, signaling a strong bullish trend.
該股票過去一年已累計上漲17.74%,年初至今漲幅爲13.11%,表明強勁看多趨勢。
With the share price consistently above its key moving averages, AT&T is riding high, though a slight selling pressure is being observed. See below.
由於股票價格始終高於其關鍵移動平均線,AT&T表現強勁,儘管存在輕微的賣壓。請參閱以下。
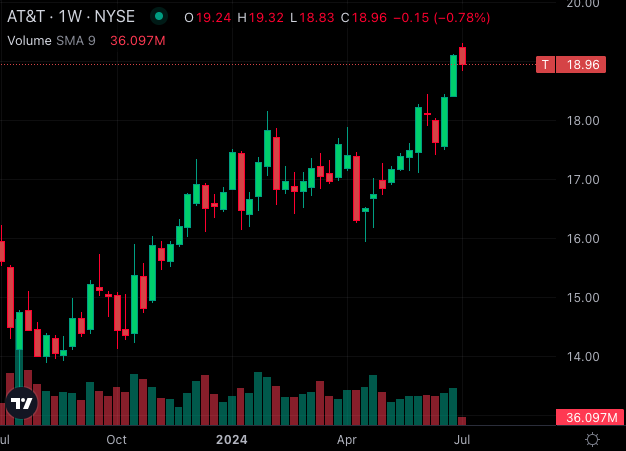
Chart created using Benzinga Pro
使用Benzinga Pro創建的圖表
Bullish Signals Across the Board
所有板塊看多信號積極
At a current share price of $18.96, AT&T is comfortably above its 5, 20 and 50-day exponential moving averages, reinforcing the bullish sentiment.
當前股價爲18.96美元時,AT&T股票舒適地位於其5、20和50日指數移動平均線之上,加強了看多情緒。
Here's a closer look at the technical indicators lighting up with bullish signals:
以下是技術指標發出積極信號的詳細信息:
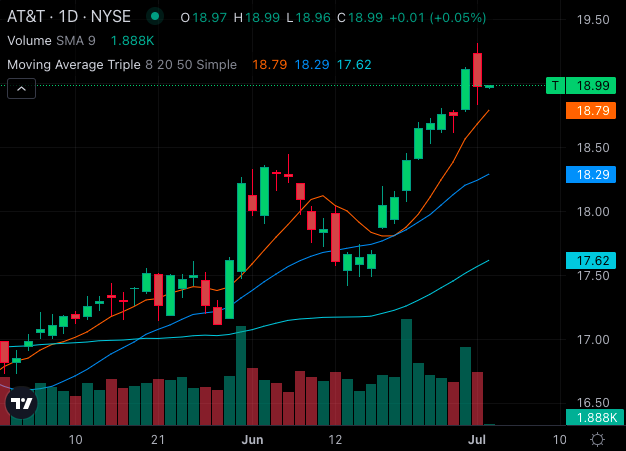
Chart created using Benzinga Pro
使用Benzinga Pro創建的圖表
- Simple Moving Averages: AT&T's share price of $18.99 is above its 8-day SMA of $18.79, 20-day SMA of $18.29 and 50-day SMA of $17.62. The 200-day SMA, standing at $16.66, further solidifies the bullish stance. These moving averages collectively indicate continued upward momentum.
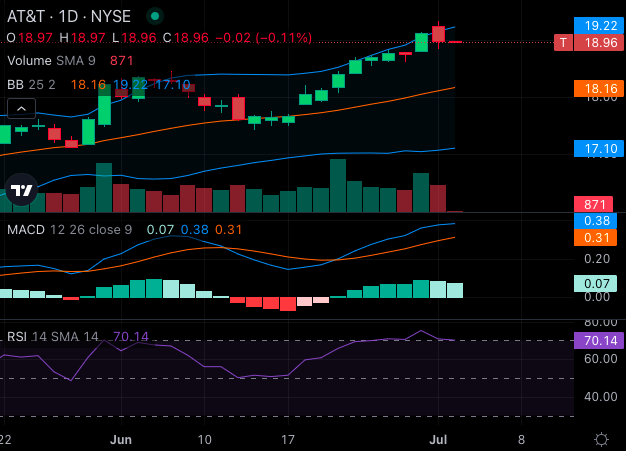
- MACD Indicator: The Moving Average Convergence Divergence (MACD) indicator for AT&T is at 0.38, a positive reading that underscores the bullish sentiment. This suggests that the stock is in a healthy uptrend, with the MACD line staying above the signal line.
- RSI and Bollinger Bands: The Relative Strength Index (RSI) for AT&T is at 70.14, indicating that the stock is overbought. Despite this, the Bollinger Bands provide additional bullish signals. The 25-day range of $17.10 – $19.22 suggests that the stock is poised for further gains.
- 簡單移動平均線:AT&T的股價爲18.99美元,高於8日SMA的18.79美元,20日SMA的18.29美元和50日SMA的17.62美元。200日SMA的高位16.66美元進一步鞏固了看多立場。這些移動平均線共同表明持續向上的動能。
- MACD指標:AT&T的移動平均收斂/發散(MACD)指標爲0.38,顯示出看多情緒。這表明該股票處於健康的上升趨勢中,MACD線保持在信號線之上。
- RSI和布林帶:AT&T的相對強弱指數(RSI)爲70.14,表明該股票已超買。儘管如此,布林帶提供了額外的看多信號。17.10美元至19.22美元的25日區間表明該股票有望進一步上漲。
Read Also: Eli Lilly Soars To 52-Week High: Can The Momentum Continue?
閱讀更多:Eli Lilly創52周新高:勢頭是否能夠持續?
52-Week High: A Bullish Milestone
52周新高:看多里程碑
The achievement of a new 52-week high at $19.32 is a significant milestone for AT&T. This high is a technical affirmation of the stock's strength. It indicates strong investor confidence and could attract more buying interest, potentially driving the stock price higher.
AT&T創造19.32美元的新52周高點是該公司的重要里程碑。這個高點是該股票強度的技術確認。它表明投資者的信心強勁,並可能吸引更多的買盤進一步推高股價。
Overall, AT&T's technical setup is overwhelmingly bullish. The stock's performance above key moving averages, positive MACD reading and favorable Bollinger Bands all point towards a continued uptrend. However, with the RSI indicating overbought conditions, investors should remain cautious of potential short-term pullbacks.
總體而言,AT&T的技術佈局明顯看多。該股票在關鍵移動平均線之上的表現,積極的MACD讀數和有利的布林帶都指向持續的上漲趨勢。但是,由於RSI指示超買情況,投資者應該保持謹慎,以防短期回撤。
Nonetheless, the new 52-week high underscores AT&T's solid momentum and bullish outlook.
儘管如此,新的52周高點突顯了AT&T的強勁勢頭和看多前景。
- Verizon, AT&T, And T-Mobile Set For Gains, Goldman Sachs Cites AI and Data Center Demand
- Verizon、AT&T和T-Mobile有望獲得收益,高盛援引人工智能和idc概念的需求。
Image: Unsplash
圖片:Unsplash
譯文內容由第三人軟體翻譯。