J.B. Hunt Transport Services' estimated fair value is US$168 based on 2 Stage Free Cash Flow to Equity
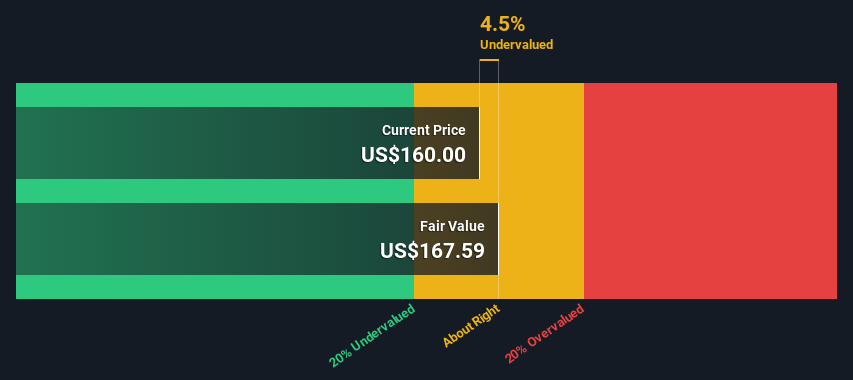
J.B. Hunt Transport Services' US$160 share price indicates it is trading at similar levels as its fair value estimate
Our fair value estimate is 11% lower than J.B. Hunt Transport Services' analyst price target of US$189
How far off is J.B. Hunt Transport Services, Inc. (NASDAQ:JBHT) from its intrinsic value? Using the most recent financial data, we'll take a look at whether the stock is fairly priced by taking the forecast future cash flows of the company and discounting them back to today's value. This will be done using the Discounted Cash Flow (DCF) model. Believe it or not, it's not too difficult to follow, as you'll see from our example!
We generally believe that a company's value is the present value of all of the cash it will generate in the future. However, a DCF is just one valuation metric among many, and it is not without flaws. For those who are keen learners of equity analysis, the Simply Wall St analysis model here may be something of interest to you.
The Model
We are going to use a two-stage DCF model, which, as the name states, takes into account two stages of growth. The first stage is generally a higher growth period which levels off heading towards the terminal value, captured in the second 'steady growth' period. To start off with, we need to estimate the next ten years of cash flows. Where possible we use analyst estimates, but when these aren't available we extrapolate the previous free cash flow (FCF) from the last estimate or reported value. We assume companies with shrinking free cash flow will slow their rate of shrinkage, and that companies with growing free cash flow will see their growth rate slow, over this period. We do this to reflect that growth tends to slow more in the early years than it does in later years.
A DCF is all about the idea that a dollar in the future is less valuable than a dollar today, so we discount the value of these future cash flows to their estimated value in today's dollars:
10-year free cash flow (FCF) forecast
2025
2026
2027
2028
2029
2030
2031
2032
2033
2034
Levered FCF ($, Millions)
US$560.8m
US$628.0m
US$655.0m
US$783.0m
US$846.5m
US$900.6m
US$947.3m
US$988.4m
US$1.03b
US$1.06b
Growth Rate Estimate Source
Analyst x5
Analyst x1
Analyst x1
Analyst x1
Est @ 8.11%
Est @ 6.39%
Est @ 5.19%
Est @ 4.34%
Est @ 3.76%
Est @ 3.34%
Present Value ($, Millions) Discounted @ 7.1%
US$524
US$548
US$533
US$596
US$601
US$597
US$587
US$572
US$554
US$535
("Est" = FCF growth rate estimated by Simply Wall St) Present Value of 10-year Cash Flow (PVCF) = US$5.6b
The second stage is also known as Terminal Value, this is the business's cash flow after the first stage. The Gordon Growth formula is used to calculate Terminal Value at a future annual growth rate equal to the 5-year average of the 10-year government bond yield of 2.4%. We discount the terminal cash flows to today's value at a cost of equity of 7.1%.
Present Value of Terminal Value (PVTV)= TV / (1 + r)10= US$23b÷ ( 1 + 7.1%)10= US$12b
The total value, or equity value, is then the sum of the present value of the future cash flows, which in this case is US$17b. In the final step we divide the equity value by the number of shares outstanding. Relative to the current share price of US$160, the company appears about fair value at a 4.5% discount to where the stock price trades currently. The assumptions in any calculation have a big impact on the valuation, so it is better to view this as a rough estimate, not precise down to the last cent.
NasdaqGS:JBHT Discounted Cash Flow July 1st 2024
The Assumptions
We would point out that the most important inputs to a discounted cash flow are the discount rate and of course the actual cash flows. If you don't agree with these result, have a go at the calculation yourself and play with the assumptions. The DCF also does not consider the possible cyclicality of an industry, or a company's future capital requirements, so it does not give a full picture of a company's potential performance. Given that we are looking at J.B. Hunt Transport Services as potential shareholders, the cost of equity is used as the discount rate, rather than the cost of capital (or weighted average cost of capital, WACC) which accounts for debt. In this calculation we've used 7.1%, which is based on a levered beta of 1.022. Beta is a measure of a stock's volatility, compared to the market as a whole. We get our beta from the industry average beta of globally comparable companies, with an imposed limit between 0.8 and 2.0, which is a reasonable range for a stable business.
SWOT Analysis for J.B. Hunt Transport Services
Strength
Debt is not viewed as a risk.
Balance sheet summary for JBHT.
Weakness
Earnings declined over the past year.
Dividend is low compared to the top 25% of dividend payers in the Transportation market.
Opportunity
Annual earnings are forecast to grow faster than the American market.
Current share price is below our estimate of fair value.
Significant insider buying over the past 3 months.
Threat
Dividends are not covered by cash flow.
Annual revenue is forecast to grow slower than the American market.
See JBHT's dividend history.
Next Steps:
Whilst important, the DCF calculation shouldn't be the only metric you look at when researching a company. It's not possible to obtain a foolproof valuation with a DCF model. Instead the best use for a DCF model is to test certain assumptions and theories to see if they would lead to the company being undervalued or overvalued. For example, changes in the company's cost of equity or the risk free rate can significantly impact the valuation. For J.B. Hunt Transport Services, we've compiled three essential items you should look at:
Financial Health: Does JBHT have a healthy balance sheet? Take a look at our free balance sheet analysis with six simple checks on key factors like leverage and risk.
Future Earnings: How does JBHT's growth rate compare to its peers and the wider market? Dig deeper into the analyst consensus number for the upcoming years by interacting with our free analyst growth expectation chart.
Other Solid Businesses: Low debt, high returns on equity and good past performance are fundamental to a strong business. Why not explore our interactive list of stocks with solid business fundamentals to see if there are other companies you may not have considered!
PS. Simply Wall St updates its DCF calculation for every American stock every day, so if you want to find the intrinsic value of any other stock just search here.
Have feedback on this article? Concerned about the content?Get in touch with us directly. Alternatively, email editorial-team (at) simplywallst.com. This article by Simply Wall St is general in nature. We provide commentary based on historical data and analyst forecasts only using an unbiased methodology and our articles are not intended to be financial advice. It does not constitute a recommendation to buy or sell any stock, and does not take account of your objectives, or your financial situation. We aim to bring you long-term focused analysis driven by fundamental data. Note that our analysis may not factor in the latest price-sensitive company announcements or qualitative material. Simply Wall St has no position in any stocks mentioned.
Have feedback on this article? Concerned about the content? Get in touch with us directly. Alternatively, email editorial-team@simplywallst.com
關鍵見解
根據兩階段自由現金流入股本計算,J.B. Hunt Transport Services的估計公允價值爲168美元
J.B. Hunt Transport Services的160美元股價表明其交易價格與其公允價值估計相似
我們的公允價值估計比J.B. Hunt Transport Services分析師設定的189美元的目標股價低11%
J.B. Hunt Transport Services, Inc.(納斯達克股票代碼:JBHT)距離其內在價值有多遠?使用最新的財務數據,我們將通過預測的公司未來現金流並將其折扣回今天的價值,來研究股票的定價是否合理。這將使用折扣現金流 (DCF) 模型來完成。信不信由你,這並不難理解,正如你將從我們的例子中看到的那樣!
我們要指出的是,貼現現金流的最重要投入是貼現率,當然還有實際的現金流。如果你不同意這些結果,那就自己計算一下,試一試假設。DCF也沒有考慮一個行業可能的週期性,也沒有考慮公司未來的資本需求,因此它沒有全面反映公司的潛在表現。鑑於我們將J.B. Hunt Transport Services視爲潛在股東,因此使用股本成本作爲貼現率,而不是構成債務的資本成本(或加權平均資本成本,WACC)。在此計算中,我們使用了7.1%,這是基於1.022的槓桿測試版。Beta是衡量股票與整個市場相比波動性的指標。我們的測試版來自全球可比公司的行業平均貝塔值,設定在0.8到2.0之間,這是一個穩定的業務的合理範圍。