
Those Who Invested in STERIS (NYSE:STE) Five Years Ago Are up 50%
Those Who Invested in STERIS (NYSE:STE) Five Years Ago Are up 50%
If you buy and hold a stock for many years, you'd hope to be making a profit. Better yet, you'd like to see the share price move up more than the market average. But STERIS plc (NYSE:STE) has fallen short of that second goal, with a share price rise of 44% over five years, which is below the market return. Unfortunately the share price is down 2.4% in the last year.
如果你買入一支股票並且持有多年,你會希望獲得利潤。更好的是,你希望看到股票價格上漲超過市場平均水平。但是思泰瑞醫療公司(NYSE:STE)沒有實現第二個目標,股票價格在五年內僅上漲了44%,低於市場回報率。不幸的是,過去一年股票價格下跌了2.4%。
So let's assess the underlying fundamentals over the last 5 years and see if they've moved in lock-step with shareholder returns.
因此,讓我們評估過去5年的基本面,看看它們是否和股東的回報率相符。
There is no denying that markets are sometimes efficient, but prices do not always reflect underlying business performance. By comparing earnings per share (EPS) and share price changes over time, we can get a feel for how investor attitudes to a company have morphed over time.
市場有時候是有效的,但價格並不總是反映公司的基本業務表現。通過比較每股收益和股價變化,我們可以了解投資者對公司的看法如何隨着時間變化而變化。
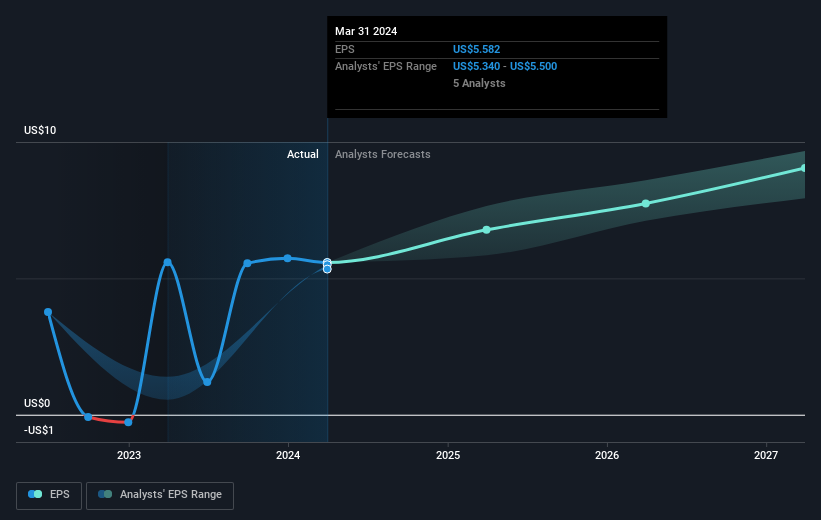
Over half a decade, STERIS managed to grow its earnings per share at 9.2% a year. This EPS growth is higher than the 8% average annual increase in the share price. So it seems the market isn't so enthusiastic about the stock these days.
在過去的五年中,思泰瑞醫療公司每股收益增長了9.2%。這種每股收益增長高於股票每年平均增長8%。因此,似乎市場這些日子對此股票不太熱衷。
The company's earnings per share (over time) is depicted in the image below (click to see the exact numbers).
該公司的每股收益(隨時間的推移)如下圖所示(單擊可查看確切數字)。
This free interactive report on STERIS' earnings, revenue and cash flow is a great place to start, if you want to investigate the stock further.
如果你想進一步調查該股票,這份關於思泰瑞醫療公司營業收入、經營利潤和現金流的免費互動報告是一個很好的起點。
What About Dividends?
那麼分紅怎麼樣呢?
It is important to consider the total shareholder return, as well as the share price return, for any given stock. The TSR incorporates the value of any spin-offs or discounted capital raisings, along with any dividends, based on the assumption that the dividends are reinvested. Arguably, the TSR gives a more comprehensive picture of the return generated by a stock. As it happens, STERIS' TSR for the last 5 years was 50%, which exceeds the share price return mentioned earlier. And there's no prize for guessing that the dividend payments largely explain the divergence!
對於任何給定的股票來說,考慮總股東回報率以及股票價格回報率至關重要。TSR包括任何分拆,折價融資,以及基於紅利再投資的分紅派息的價值,並假設分紅派息再投資。可以說,TSR更全面地反映了一隻股票所產生的回報情況。碰巧的是,思泰瑞醫療公司過去5年的TSR爲50%,超過了先前提到的股票價格回報。而且,毫無疑問,分紅派息在很大程度上解釋了這種分離!
A Different Perspective
不同的觀點
STERIS shareholders are down 1.5% for the year (even including dividends), but the market itself is up 23%. Even the share prices of good stocks drop sometimes, but we want to see improvements in the fundamental metrics of a business, before getting too interested. On the bright side, long term shareholders have made money, with a gain of 9% per year over half a decade. It could be that the recent sell-off is an opportunity, so it may be worth checking the fundamental data for signs of a long term growth trend. It's always interesting to track share price performance over the longer term. But to understand STERIS better, we need to consider many other factors. Even so, be aware that STERIS is showing 2 warning signs in our investment analysis , you should know about...
思泰瑞醫療公司的股東今年下跌了1.5%(包括分紅派息),但市場本身上漲了23%。即使似乎好股票的股票價格有時也會下降,但我們希望看到一家商業公司的基本指標有所改善,然後再進一步關注。光明的一面是,長期股東已經賺到了錢,五年內每年增長了9%。最近的拋售可能會是一個機會,因此,值得檢查基本數據是否存在長期增長趨勢的跡象。跟蹤股票價格長期表現總是有趣的。但要更好地了解思泰瑞醫療公司,我們需要考慮許多其他因素。即便如此,另外要知道,在我們的投資分析中,思泰瑞醫療公司顯示了2個警告標誌。
If you like to buy stocks alongside management, then you might just love this free list of companies. (Hint: many of them are unnoticed AND have attractive valuation).
如果您喜歡與管理層一起購買股票,那麼您可能會喜歡這個公司的免費列表。 (提示:其中許多公司不爲人注意且具有吸引力的估值。)
Please note, the market returns quoted in this article reflect the market weighted average returns of stocks that currently trade on American exchanges.
請注意,本文所引述的市場回報反映了目前在美國交易所上市的股票的市場加權平均回報。
Have feedback on this article? Concerned about the content? Get in touch with us directly. Alternatively, email editorial-team (at) simplywallst.com.
This article by Simply Wall St is general in nature. We provide commentary based on historical data and analyst forecasts only using an unbiased methodology and our articles are not intended to be financial advice. It does not constitute a recommendation to buy or sell any stock, and does not take account of your objectives, or your financial situation. We aim to bring you long-term focused analysis driven by fundamental data. Note that our analysis may not factor in the latest price-sensitive company announcements or qualitative material. Simply Wall St has no position in any stocks mentioned.
對本文有反饋?關於內容有所顧慮?直接和我們聯繫。或者,發送電子郵件至editorial-team (at) simplywallst.com。
這篇文章是Simply Wall St的一般性文章。我們根據歷史數據和分析師預測提供評論,只使用公正的方法論,我們的文章並不意味着提供任何金融建議。文章不構成買賣任何股票的建議,也不考慮您的目標或您的財務狀況。我們的目標是帶給您基本數據驅動的長期關注分析。請注意,我們的分析可能不考慮最新的價格敏感公司公告或定性材料。Simply Wall St沒有任何股票頭寸。
Have feedback on this article? Concerned about the content? Get in touch with us directly. Alternatively, email editorial-team@simplywallst.com
對本文有反饋?關於內容有所顧慮?直接和我們聯繫。或者發送電子郵件至editorial-team@simplywallst.com。
譯文內容由第三人軟體翻譯。