
ICON (NASDAQ:ICLR) has had a rough three months with its share price down 6.8%. But if you pay close attention, you might find that its key financial indicators look quite decent, which could mean that the stock could potentially rise in the long-term given how markets usually reward more resilient long-term fundamentals. In this article, we decided to focus on ICON's ROE.
Return on equity or ROE is a key measure used to assess how efficiently a company's management is utilizing the company's capital. In short, ROE shows the profit each dollar generates with respect to its shareholder investments.
How To Calculate Return On Equity?
The formula for return on equity is:
Return on Equity = Net Profit (from continuing operations) ÷ Shareholders' Equity
So, based on the above formula, the ROE for ICON is:
7.2% = US$683m ÷ US$9.4b (Based on the trailing twelve months to March 2024).
The 'return' is the amount earned after tax over the last twelve months. Another way to think of that is that for every $1 worth of equity, the company was able to earn $0.07 in profit.
Why Is ROE Important For Earnings Growth?
So far, we've learned that ROE is a measure of a company's profitability. Depending on how much of these profits the company reinvests or "retains", and how effectively it does so, we are then able to assess a company's earnings growth potential. Generally speaking, other things being equal, firms with a high return on equity and profit retention, have a higher growth rate than firms that don't share these attributes.
ICON's Earnings Growth And 7.2% ROE
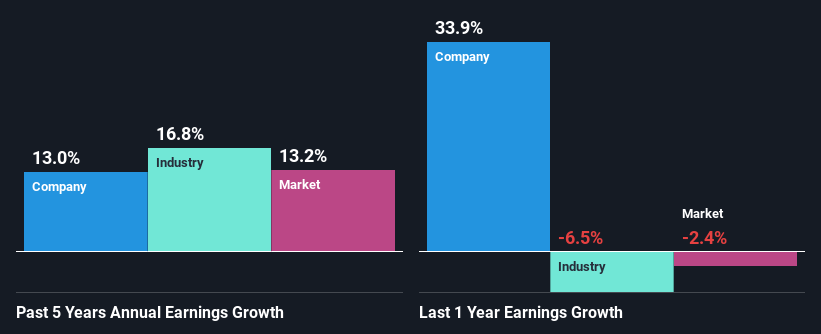
On the face of it, ICON's ROE is not much to talk about. We then compared the company's ROE to the broader industry and were disappointed to see that the ROE is lower than the industry average of 12%. Although, we can see that ICON saw a modest net income growth of 13% over the past five years. We reckon that there could be other factors at play here. For instance, the company has a low payout ratio or is being managed efficiently.
We then compared ICON's net income growth with the industry and found that the company's growth figure is lower than the average industry growth rate of 17% in the same 5-year period, which is a bit concerning.
Earnings growth is an important metric to consider when valuing a stock. The investor should try to establish if the expected growth or decline in earnings, whichever the case may be, is priced in. By doing so, they will have an idea if the stock is headed into clear blue waters or if swampy waters await. What is ICLR worth today? The intrinsic value infographic in our free research report helps visualize whether ICLR is currently mispriced by the market.
Is ICON Making Efficient Use Of Its Profits?
ICON doesn't pay any regular dividends currently which essentially means that it has been reinvesting all of its profits into the business. This definitely contributes to the decent earnings growth number that we discussed above.
Summary
On the whole, we do feel that ICON has some positive attributes. Namely, its respectable earnings growth, which it achieved due to it retaining most of its profits. However, given the low ROE, investors may not be benefitting from all that reinvestment after all. We also studied the latest analyst forecasts and found that the company's earnings growth is expected be similar to its current growth rate. Are these analysts expectations based on the broad expectations for the industry, or on the company's fundamentals? Click here to be taken to our analyst's forecasts page for the company.
Have feedback on this article? Concerned about the content? Get in touch with us directly. Alternatively, email editorial-team (at) simplywallst.com.
This article by Simply Wall St is general in nature. We provide commentary based on historical data and analyst forecasts only using an unbiased methodology and our articles are not intended to be financial advice. It does not constitute a recommendation to buy or sell any stock, and does not take account of your objectives, or your financial situation. We aim to bring you long-term focused analysis driven by fundamental data. Note that our analysis may not factor in the latest price-sensitive company announcements or qualitative material. Simply Wall St has no position in any stocks mentioned.
Have feedback on this article? Concerned about the content? Get in touch with us directly. Alternatively, email editorial-team@simplywallst.com