
CarGurus' (NASDAQ:CARG) Earnings Have Declined Over Five Years, Contributing to Shareholders 28% Loss
CarGurus' (NASDAQ:CARG) Earnings Have Declined Over Five Years, Contributing to Shareholders 28% Loss
CarGurus, Inc. (NASDAQ:CARG) shareholders should be happy to see the share price up 12% in the last quarter. But that doesn't change the fact that the returns over the last five years have been less than pleasing. You would have done a lot better buying an index fund, since the stock has dropped 28% in that half decade.
納斯達克股票代碼爲CARG的CarGurus公司股東應該很高興,在過去的一個季度裏股價上漲了12%。但是過去五年的回報不盡如人意。如果您購買指數基金,您的表現會更好,因爲股票在那五年中下跌了28%。
While the last five years has been tough for CarGurus shareholders, this past week has shown signs of promise. So let's look at the longer term fundamentals and see if they've been the driver of the negative returns.
雖然過去五年對於CarGurus的股東來說很艱難,但上週顯示出了跡象。因此,讓我們看看長期的基本面,看看它們是否是負回報的驅動因素。
There is no denying that markets are sometimes efficient, but prices do not always reflect underlying business performance. By comparing earnings per share (EPS) and share price changes over time, we can get a feel for how investor attitudes to a company have morphed over time.
市場有時候是有效的,但價格並不總是反映公司的基本業務表現。通過比較每股收益和股價變化,我們可以了解投資者對公司的看法如何隨着時間變化而變化。
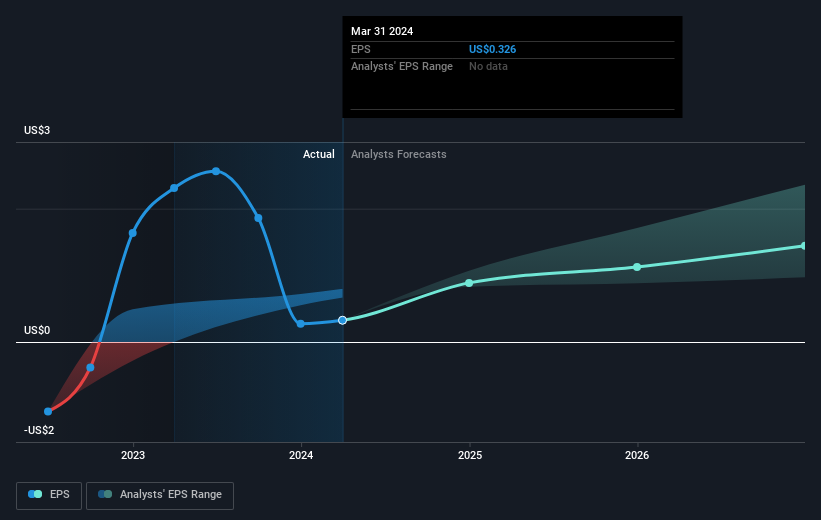
During the five years over which the share price declined, CarGurus' earnings per share (EPS) dropped by 12% each year. The share price decline of 6% per year isn't as bad as the EPS decline. So investors might expect EPS to bounce back -- or they may have previously foreseen the EPS decline. The high P/E ratio of 74.31 suggests that shareholders believe earnings will grow in the years ahead.
在股價下跌的五年內,CarGurus的每股收益(EPS)每年下降12%。每年6%的股價下跌不像EPS下降那麼糟糕。因此,投資者可能會期望EPS會反彈,或者他們曾經預見到EPS下降。高達74.31的市盈率表明股東認爲盈利將在未來幾年增長。
The company's earnings per share (over time) is depicted in the image below (click to see the exact numbers).
該公司的每股收益(隨時間的推移)如下圖所示(單擊可查看確切數字)。
It's probably worth noting that the CEO is paid less than the median at similar sized companies. But while CEO remuneration is always worth checking, the really important question is whether the company can grow earnings going forward. Dive deeper into the earnings by checking this interactive graph of CarGurus' earnings, revenue and cash flow.
值得注意的是,該公司CEO的薪酬低於類似規模公司的中位數。但是,雖然CEO的報酬總是值得檢查,但真正重要的問題是公司未來能否增長收益。通過檢查CarGurus公司的收益、營收和現金流動情況的交互圖來深入了解收益。
A Different Perspective
不同的觀點
CarGurus shareholders gained a total return of 14% during the year. Unfortunately this falls short of the market return. But at least that's still a gain! Over five years the TSR has been a reduction of 5% per year, over five years. So this might be a sign the business has turned its fortunes around. I find it very interesting to look at share price over the long term as a proxy for business performance. But to truly gain insight, we need to consider other information, too. To that end, you should be aware of the 2 warning signs we've spotted with CarGurus .
CarGurus的股東在過去一年中獲得了14%的總回報。不幸的是,這低於市場回報。但至少還是有所增益!在五年內,TSR每年減少了5%,超過五年。因此,這可能是企業扭轉局面的跡象。我認爲長期觀察股價作爲業績的代理非常有趣。但是,爲了真正獲得洞察力,我們需要考慮其他信息。爲此,您應該知道我們在 CarGurus發現的2個警告標誌。
Of course CarGurus may not be the best stock to buy. So you may wish to see this free collection of growth stocks.
當然,CarGurus可能不是最好的投資股票。因此,您可能希望查看這些免費的成長股收藏。
Please note, the market returns quoted in this article reflect the market weighted average returns of stocks that currently trade on American exchanges.
請注意,本文所引述的市場回報反映了目前在美國交易所上市的股票的市場加權平均回報。
Have feedback on this article? Concerned about the content? Get in touch with us directly. Alternatively, email editorial-team (at) simplywallst.com.
This article by Simply Wall St is general in nature. We provide commentary based on historical data and analyst forecasts only using an unbiased methodology and our articles are not intended to be financial advice. It does not constitute a recommendation to buy or sell any stock, and does not take account of your objectives, or your financial situation. We aim to bring you long-term focused analysis driven by fundamental data. Note that our analysis may not factor in the latest price-sensitive company announcements or qualitative material. Simply Wall St has no position in any stocks mentioned.
對本文有反饋?關於內容有所顧慮?直接和我們聯繫。或者,發送電子郵件至editorial-team (at) simplywallst.com。
這篇文章是Simply Wall St的一般性文章。我們根據歷史數據和分析師預測提供評論,只使用公正的方法論,我們的文章並不意味着提供任何金融建議。文章不構成買賣任何股票的建議,也不考慮您的目標或您的財務狀況。我們的目標是帶給您基本數據驅動的長期關注分析。請注意,我們的分析可能不考慮最新的價格敏感公司公告或定性材料。Simply Wall St沒有任何股票頭寸。
Have feedback on this article? Concerned about the content? Get in touch with us directly. Alternatively, email editorial-team@simplywallst.com
對本文有反饋?關於內容有所顧慮?直接和我們聯繫。或者發送電子郵件至editorial-team@simplywallst.com。
譯文內容由第三人軟體翻譯。