
Should Weakness in Chemed Corporation's (NYSE:CHE) Stock Be Seen As A Sign That Market Will Correct The Share Price Given Decent Financials?
Should Weakness in Chemed Corporation's (NYSE:CHE) Stock Be Seen As A Sign That Market Will Correct The Share Price Given Decent Financials?
It is hard to get excited after looking at Chemed's (NYSE:CHE) recent performance, when its stock has declined 17% over the past three months. However, the company's fundamentals look pretty decent, and long-term financials are usually aligned with future market price movements. In this article, we decided to focus on Chemed's ROE.
最近三個月,Chemed (紐交所:chemed) 的股價下跌了17%,這讓人難以激動起來。然而,該公司的基本面看起來相當不錯,長期財務狀況通常與未來的市場價格走勢保持一致。在本文中,我們決定重點關注 Chemed 的roe。
Return on Equity or ROE is a test of how effectively a company is growing its value and managing investors' money. In short, ROE shows the profit each dollar generates with respect to its shareholder investments.
股東權益回報率(ROE)是檢驗公司增加其價值和管理投資者資金有效性的測試。簡而言之,ROE顯示每個美元的利潤與其股東的投資有關。
How To Calculate Return On Equity?
如何計算股東權益報酬率?
The formula for ROE is:
roe的公式是:
Return on Equity = Net Profit (from continuing operations) ÷ Shareholders' Equity
淨資產收益率 = 淨利潤(從持續經營中獲得)÷ 股東權益
So, based on the above formula, the ROE for Chemed is:
因此,根據上述公式,Chemed的ROE爲:
24% = US$283m ÷ US$1.2b (Based on the trailing twelve months to March 2024).
24%= 283m美元 ÷ 12億美元(基於截至2024年3月的過去十二個月)。
The 'return' is the yearly profit. That means that for every $1 worth of shareholders' equity, the company generated $0.24 in profit.
“回報”是每年的利潤。這意味着公司每1美元股東權益產生0.24美元的利潤。
What Is The Relationship Between ROE And Earnings Growth?
既然我們已經確定ROE是一種有效的利潤生成標準,用於評估公司未來的盈利能力,我們現在需要評估公司“保留”爲未來增長而重新投資的利潤多少,這使我們對公司的增長潛力有了一個了解。一般而言,在其他條件相等的情況下,ROE和利潤留存高的公司,增長率比沒有這些屬性的公司要高。
So far, we've learned that ROE is a measure of a company's profitability. We now need to evaluate how much profit the company reinvests or "retains" for future growth which then gives us an idea about the growth potential of the company. Assuming all else is equal, companies that have both a higher return on equity and higher profit retention are usually the ones that have a higher growth rate when compared to companies that don't have the same features.
到目前爲止,我們已經了解到 ROE 是衡量公司盈利能力的一種指標。現在,我們需要評估公司重新投資或“保留”的利潤有多少,以此來衡量公司的成長潛力。其他因素相同的情況下,具有更高的股本回報率和更高的利潤保留的公司通常比沒有相同特徵的公司具有更高的增長率。
Chemed's Earnings Growth And 24% ROE
Chemed的盈利增長和24%的ROE
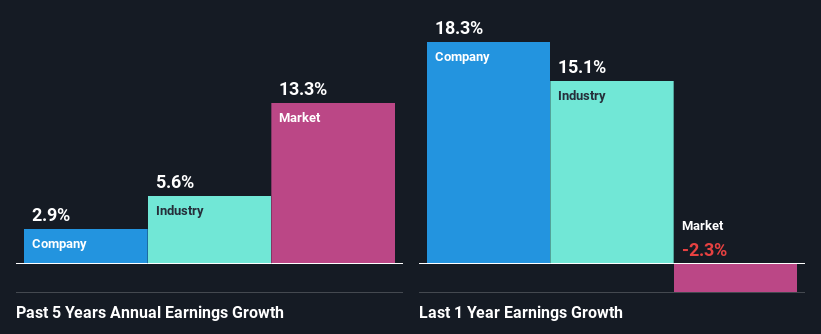
First thing first, we like that Chemed has an impressive ROE. Secondly, even when compared to the industry average of 11% the company's ROE is quite impressive. Yet, Chemed has posted measly growth of 2.9% over the past five years. This is interesting as the high returns should mean that the company has the ability to generate high growth but for some reason, it hasn't been able to do so. Such a scenario is likely to take place when a company pays out a huge portion of its earnings as dividends, or is faced with competitive pressures.
首先,我們喜歡 Chemed 具有令人印象深刻的ROE。其次,即使與11%的行業平均水平相比,該公司的ROE也相當出色。然而,在過去的五年中,Chemed的增長率僅爲2.9%。這很有趣,因爲高收益應意味着公司有能力實現高增長,但出於某種原因,它未能這樣做。這種情況很可能發生在一個公司把巨額收益支付爲股息,或面臨競爭壓力的情況下。
We then compared Chemed's net income growth with the industry and found that the company's growth figure is lower than the average industry growth rate of 5.6% in the same 5-year period, which is a bit concerning.
我們隨後將Chemed的淨收入增長與行業進行了比較,並發現該公司的增長數字低於同一5年期內行業平均增長率的5.6%,這有點令人擔憂。
The basis for attaching value to a company is, to a great extent, tied to its earnings growth. What investors need to determine next is if the expected earnings growth, or the lack of it, is already built into the share price. This then helps them determine if the stock is placed for a bright or bleak future. What is CHE worth today? The intrinsic value infographic in our free research report helps visualize whether CHE is currently mispriced by the market.
評估公司價值的基礎在很大程度上與其盈利增長相聯繫。投資者需要判斷的下一步是預期的盈利增長是否已經反映在股價中,或者缺乏盈利增長是否已經反映在股價之中。這有助於他們判斷股票的未來是否光明或黯淡。CHE今天的價值是多少?我們免費研究報告中的內在價值信息圖可視化表明CHE當前是否被市場錯誤定價。
Is Chemed Making Efficient Use Of Its Profits?
Chemed是否有效利用其利潤?
A low three-year median payout ratio of 8.4% (implying that the company retains the remaining 92% of its income) suggests that Chemed is retaining most of its profits. This should be reflected in its earnings growth number, but that's not the case. So there could be some other explanation in that regard. For instance, the company's business may be deteriorating.
低達三年的中位數8.4%的低派息比率(意味着公司保留其收入的其餘92%)表明Chemed保留了大部分利潤。這應該反映在其盈利增長數字中,但事實並非如此。因此,可能存在其他說明。例如,公司的業務可能正在惡化。
Additionally, Chemed has paid dividends over a period of at least ten years, which means that the company's management is determined to pay dividends even if it means little to no earnings growth.
此外,Chemed已經連續十年派發股息,這意味着即使沒有盈利增長,公司管理層仍決心支付股息。
Conclusion
結論
Overall, we feel that Chemed certainly does have some positive factors to consider. Yet, the low earnings growth is a bit concerning, especially given that the company has a high rate of return and is reinvesting ma huge portion of its profits. By the looks of it, there could be some other factors, not necessarily in control of the business, that's preventing growth. That being so, the latest analyst forecasts show that the company will continue to see an expansion in its earnings. Are these analysts expectations based on the broad expectations for the industry, or on the company's fundamentals? Click here to be taken to our analyst's forecasts page for the company.
總的來說,我們認爲Chemed當然有一些值得考慮的積極因素。然而,低的盈利增長有點令人擔憂,特別是考慮到該公司具有高的回報率並且正在重新投資其大部分利潤。看起來可能有一些其他因素,不一定在企業的控制之下,阻礙了增長。就算這樣,最新的分析師預測顯示,該公司的盈利將繼續增長。這些分析師的預測是否基於行業的廣泛預期,還是基於公司的基本面?單擊此處,進入我們的分析師預測頁面。
Have feedback on this article? Concerned about the content? Get in touch with us directly. Alternatively, email editorial-team (at) simplywallst.com.
This article by Simply Wall St is general in nature. We provide commentary based on historical data and analyst forecasts only using an unbiased methodology and our articles are not intended to be financial advice. It does not constitute a recommendation to buy or sell any stock, and does not take account of your objectives, or your financial situation. We aim to bring you long-term focused analysis driven by fundamental data. Note that our analysis may not factor in the latest price-sensitive company announcements or qualitative material. Simply Wall St has no position in any stocks mentioned.
對本文有反饋?關於內容有所顧慮?直接和我們聯繫。或者,發送電子郵件至editorial-team (at) simplywallst.com。
這篇文章是Simply Wall St的一般性文章。我們根據歷史數據和分析師預測提供評論,只使用公正的方法論,我們的文章並不意味着提供任何金融建議。文章不構成買賣任何股票的建議,也不考慮您的目標或您的財務狀況。我們的目標是帶給您基本數據驅動的長期關注分析。請注意,我們的分析可能不考慮最新的價格敏感公司公告或定性材料。Simply Wall St沒有任何股票頭寸。
Have feedback on this article? Concerned about the content? Get in touch with us directly. Alternatively, email editorial-team@simplywallst.com
對本文有反饋?關於內容有所顧慮?直接和我們聯繫。或者發送電子郵件至editorial-team@simplywallst.com。
譯文內容由第三人軟體翻譯。